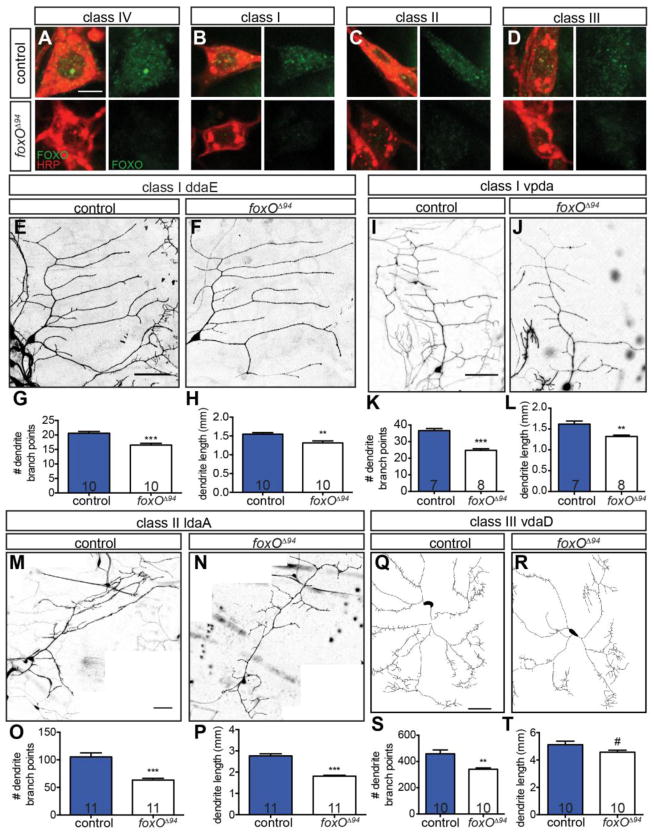
Figure 3. FoxO is expressed in da neurons and regulates class I–III dendrite morphology.
(A–D) FoxO staining (green) of FoxO positive controls and foxOΔ94 class I–IV cells, counterstained for HRP (red). Scale bar: 5 μm. (E, F, I, J, M, N) Representative z-projections of class I and II cells of the indicated cell type and backgrounds, marked with mCD8-GFP driven by C161-GAL4. (G) Quantification of branch point numbers in class I ddaE cells in control animals: 20.6 ± 0.6, n=10 cells; foxOΔ94 animals: 16.5 ± 0.6, n=10 cells. (H) Quantification of dendrite length in class I ddaE in control animals: 1.55 ± 0.04 mm, n=10 cells; foxOΔ94 animals: 1.31 ± 0.06 mm, n=10 cells. (K) Quantification of branch point numbers in class I vpda cells in control animals: 36.6 ± 1.3, n=7 cells; foxOΔ94 animals: 24.8 ± 1.0, n=8 cells. (L) Quantification of dendrite length in class I vpda in control animals: 1.62 ± 0.07 mm, n=7 cells; foxOΔ94 animals: 1.32 ± 0.03 mm, n=8 cells. (O) Quantification of branch point numbers in class II ldaA cells in control animals: 105.4 ± 7.2, n=11 cells; foxOΔ94 animals: 63.2 ± 3.2, n=11 cells. (P) Quantification of dendrite length in class II ldaA in control animals: 2.76 ± 0.10 mm, n=11 cells; foxOΔ94 animals: 1.81 ± 0.04 mm, n=11 cells. (Q–R) Representative traces of class III vdaD cells of the indicated backgrounds, marked with mCD8-GFP driven by C161-GAL4. (S) Quantification of branch point numbers in class III vdaD cells in control animals: 458.7 ± 29.1, n=10 cells; foxOΔ94 animals: 341.4 ± 10.1, n=10 cells. (T) Quantification of dendrite length in class III vdaD in control animals: 5.12 ± 0.26 mm, n=10 cells; foxOΔ94 animals: 4.57 ± 0.14 mm, n=10 cells. Scale bars in E, I, M, and Q: 50 μm. Error bars are mean ± s.e.m., #, p<0.1, **, p<0.01, ***, p<0.001.

