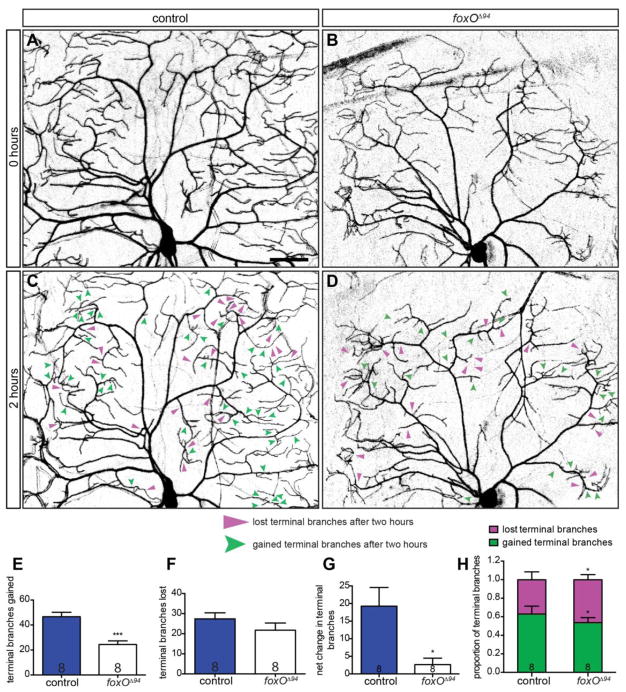
Figure 4. FoxO promotes initiation and stabilization of new branches.
(A–D) Representative images of class IV ddaC cells within intact, 96 h AEL animals, marked with mCD8-GFP driven by 477-GAL4, in the indicated backgrounds and time points. Filled, magenta arrows indicate lost terminal branches after a two-hour period, while notched, green arrows indicate new terminal branches. (E) Quantification of gained branch points after a two-hour period, controls: 46.6 ± 3.6, n=8 cells; foxOΔ94 animals: 24.4 ± 2.9, n=8 cells. (F) Quantification of lost branch point after a two-hour period, controls: 27.4 ± 3.0, n=8; foxOΔ94 animals: 21.8 ± 3.6, n=8 cells. (G) Quantification of net branches after a two-hour period, controls: 19.3 ± 5.3, n=8 cells; foxOΔ94 animals: 2.6 ± 1.8, n=8 cells. (H) Quantification of the proportion of gained branches compared with lost branches over a two-hour period, gained branches in controls: 0.63 ± 0.04, n=8 cells; lost branches in controls: 0.37 ± 0.04, n=8 cells; gained branches in foxOΔ94 animals: 0.54 ± 0.02, n=8 cells; lost branches in foxOΔ94 animals: 0.46 ± 0.02, n=8 cells. Scale bar: 50 μm. Error bars are mean ± s.e.m., *, p<0.05, ***, p<0.001.

