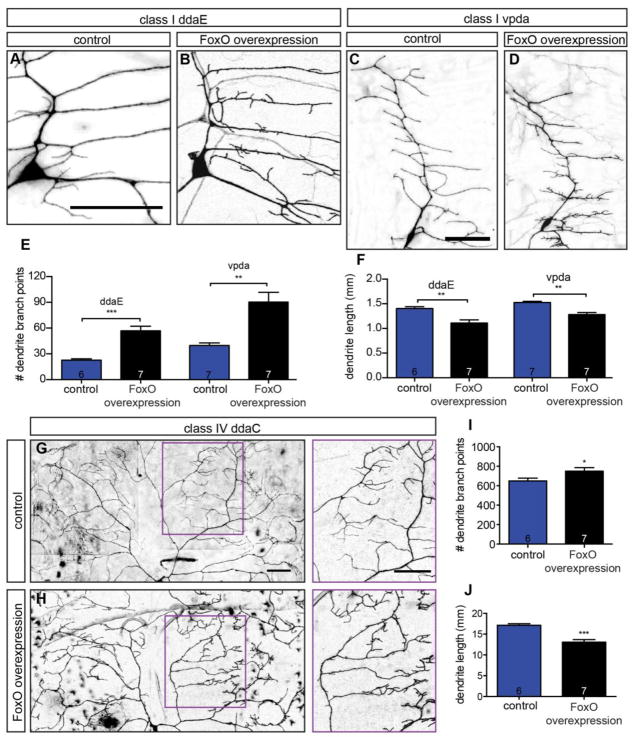
Figure 5. FoxO is sufficient to promote branch formation.
(A–D) Representative z-projections of class I ddaE and vpda cells of the indicated backgrounds, marked with mCD8-GFP driven by 2-21-GAL4. (E) Quantification of class I branch point numbers in animals expressing control RNAi #2 in ddaE: 22.7 ± 1.6, n=6 cells; control RNAi #2 in vpda: 39.7 ± 3.1, n=7 cells; FoxO WT #1 in ddaE: 56.9 ± 5.3, n=7 cells; FoxO WT #1 in vpda: 90.3 ± 11.4, n=7 cells. (F) Quantification of class I dendrite length in animals expressing control RNAi #2 in ddaE: 1.40 ± 0.04 mm, n=6 cells; control RNAi #2 in vpda: 1.52 ± 0.02 mm, n=7 cells; FoxO WT #1 in ddaE: 1.11 ± 0.07 mm, n=7 cells; FoxO WT #1 in vpda: 1.27 ± 0.05 mm, n=7 cells. (G–H) Representative z-projections of class IV ddaC cells of the indicated backgrounds, marked with mCD8-GFP driven by 477-GAL4. Magenta boxes in A and B are magnified in side panels. (I) Quantification of class IV ddaC branch point numbers in animals expressing control RNAi #1: 649.0 ± 28.6, n=6 cells; FoxO WT #2: 749.7 ± 35.4, n=7 cells. (J) Quantification of class IV ddaC dendrite length in animals expressing control RNAi #1: 17.12 ± 0.37 mm, n=6 cells; FoxO WT #2: 13.08 ± 0.61 mm, n=7 cells. Scale bars: 50 μm. Error bars are mean ± s.e.m., *, p<0.05, **, p<0.01, ***, p<0.001.

