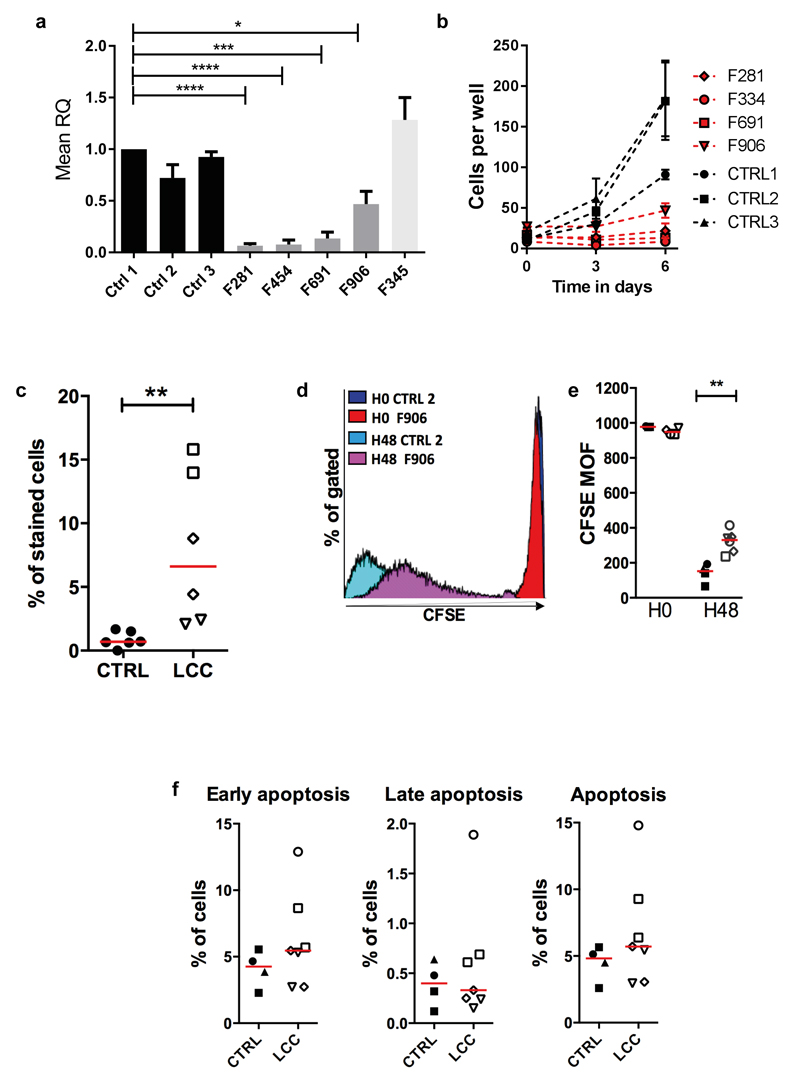
Fig. 6. Defective proliferation of LCC fibroblasts.
(a). Quantitative reverse transcription PCR (qPCR) of SNORD118 expression in three control (CTRL1, 2, 3), four LCC (F281, F454, F691, F906), and one CP patient (F345) primary fibroblast cell lines, normalized to two housekeeping genes, RNU24 and U6. RQ is equal to 2-ΔΔCt i.e. normalized fold change relative to CTRL1. Data given as mean +/- SEM; n=3 independent experiments. Data analyzed using one way Anova with multiple comparisons **** = p<0.0001. (b). Proliferation of patient (F281, F334, F691, F906) and control (CTRL1, 2, 3) fibroblasts. The passage number of patient cells was the same or lower than controls, except for F691 which had 3 more passages. Data given as mean +/- SEM; n=2 independent experiments. (c). Percentage of beta galactosidase positive control (n=3) and LCC (n=3) fibroblasts. Red bar represents median value for each group. Mann Whitney U test **p<0.01. (d). Representative histogram of fibroblasts from one patient (F906) and one control (CTRL2). Mean of Fluorescence (MOF) assessed at 30 minutes (H0) and 2 days (H48) after carboxyfluorescein succinimidyl ester (CFSE) labeling. (e). Quantification of mean CFSE fluorescence in fibroblasts from patients (n=4) and controls (n=3). Red bar represents median value for each group. Mann Whitney U test **p<0.01; n=2 independent experiments. (f). Percentage cells in early, late and total apoptosis for four patients and three controls. Red bar represents median value for each group. No significant difference by Mann Whitney U testing; n=2 independent experiments. ●CTRL1, ■CTRL2, ▲CTRL3, ◊F281, ○F334, □F691, ▿F906.

