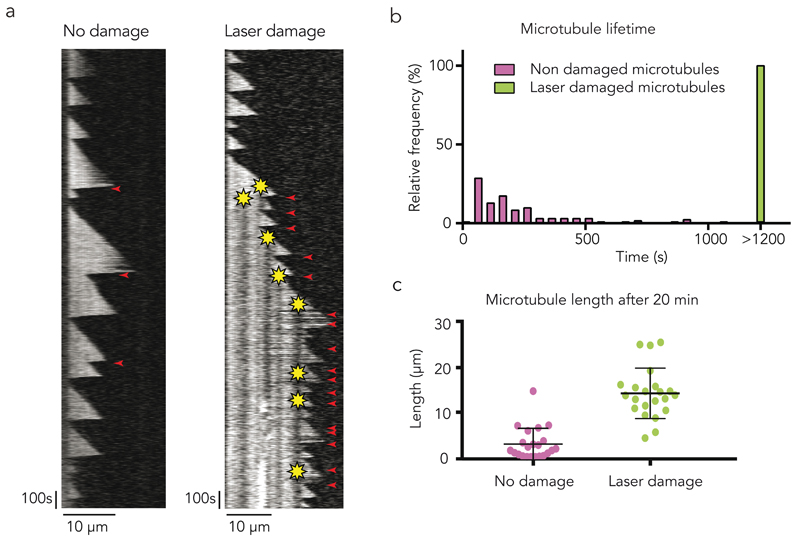
Figure 6. Self-repair biases microtubule dynamic instability in vitro.
(a) The kymograph on the left shows a typical non-damaged microtubule with infrequent rescue events. On the right, the microtubule was damaged several times close to the tip as soon as it grew out long enough. Though catastrophe events were frequent, this microtubule was protected from complete depolymerisation by the photo damage. Yellow star indicates the photo-damage site. Red arrowhead indicates rescue events.
(b) Damages increase microtubule lifetime. The graph shows the distribution of 28 laser damaged (green) and 133 non-damaged (magenta) microtubule lifetime. Damaged microtubule lifetime was found to be considerably longer than the lifetime of non-damaged microtubules.
(c) Damages increase microtubule length. The graph shows the length of laser damaged (green) and non-damaged (magenta) microtubule after 20 minutes. Error bars show mean +/- s.d. for n = 22 microtubules per condition, pooled from 4 independent experiments.

