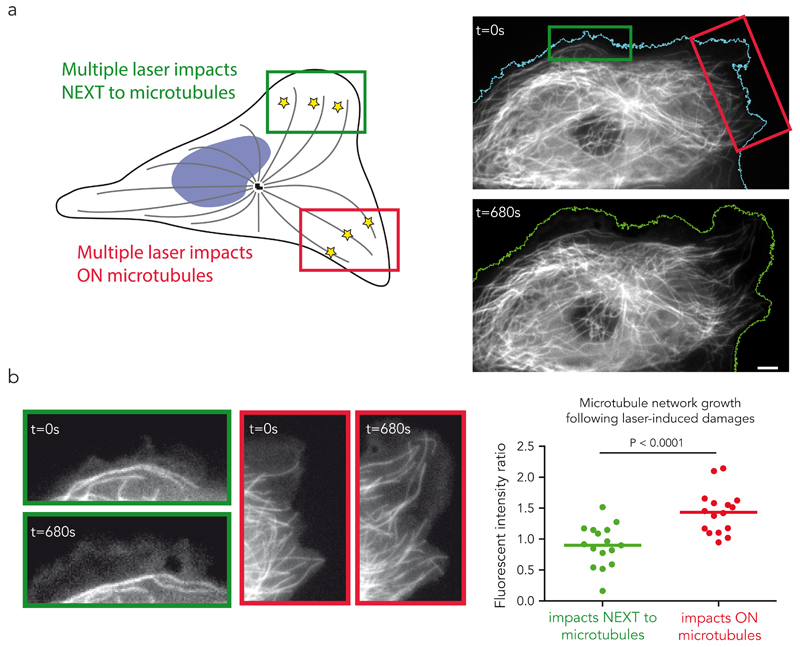
Figure 7. Self-repair biases microtubule dynamic instability in vivo.
(a) Repeated microtubule shooting “on” and “off-target”. Laser induced photo-damage were targeted either on the microtubules, in the red region, or next to the microtubules, in the green region. The images show the cell before (top) and after (bottom) the shooting. Comparison of the left and right cell margin pre- and post-photo-damage. Scale bar is 5 µm.
(b) Preferential microtubule network growth in damaged regions. Images show the microtubule network in the “on-target” (red) and “off-target” (green) regions before (t=0s) and after (t=680s) the shooting. The graph shows the after/before ratio of the mean microtubule fluorescence intensity in each region. Lines represent mean values from n=16 cells from 4 independent experiments. P value was generated by a wilcoxon paired test. The total microtubule length increased in the regions where the laser impacts were targeted on the microtubules. Scale bar is 2 µm.

