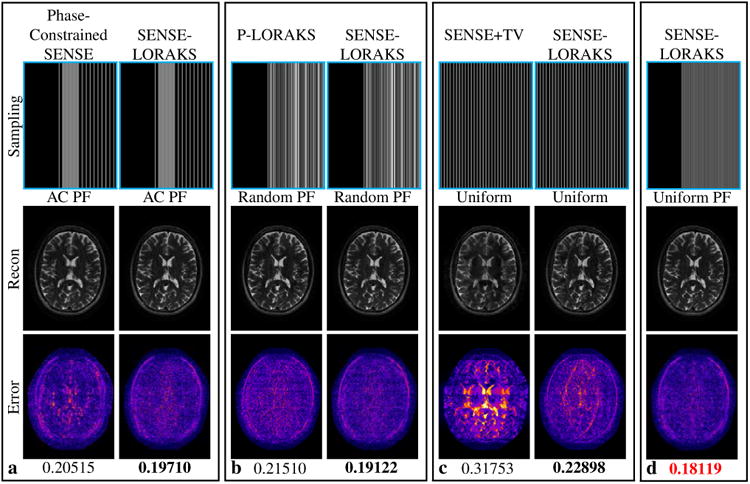
Figure 5.

Comparison of SENSE-LORAKS against (a) phase-constrained SENSE with AC PF sampling, (b) P-LORAKS with Random PF sampling, and (c) SENSE+TV with conventional Uniform sampling for the TSE dataset with 5.1× acceleration. Reconstructions obtained using SENSE-LORAKS with Uniform PF sampling are shown in (d). Images for other acceleration factors are shown in Supporting Figs. S5 and S6, while NRMSE values are plotted in Fig. 7(a). The reconstructed images are displayed using a linear grayscale (normalized so that image intensities are in the range from 0 to 1). The error images are displayed using the indicated colorscale (which ranges from 0 to 0.25 to highlight small errors). NRMSE values are shown underneath each reconstruction, with the best NRMSE values highlighted with bold text in each sampling pattern. The smallest NRMSE values for a given acceleration rate are indicated in red.
