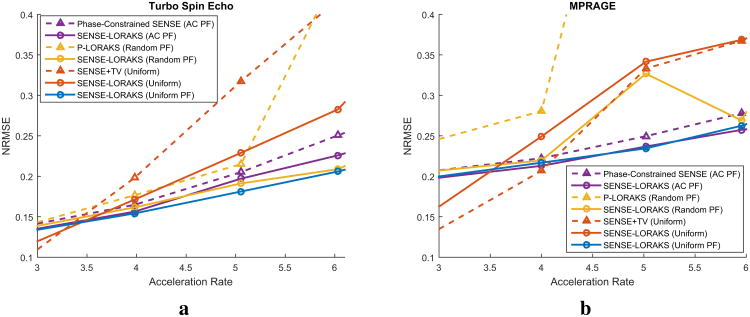
Figure 7.
Plots of the reconstruction NRMSE as a function of the acceleration rate for the (a) TSE data (corresponding images were shown in Fig. 5 and Supporting Figs. S5 and S6) and (b) MPRAGE data (corresponding images were shown in Fig. 6 and Supporting Figs. S7 and S8).

