Figure 1.
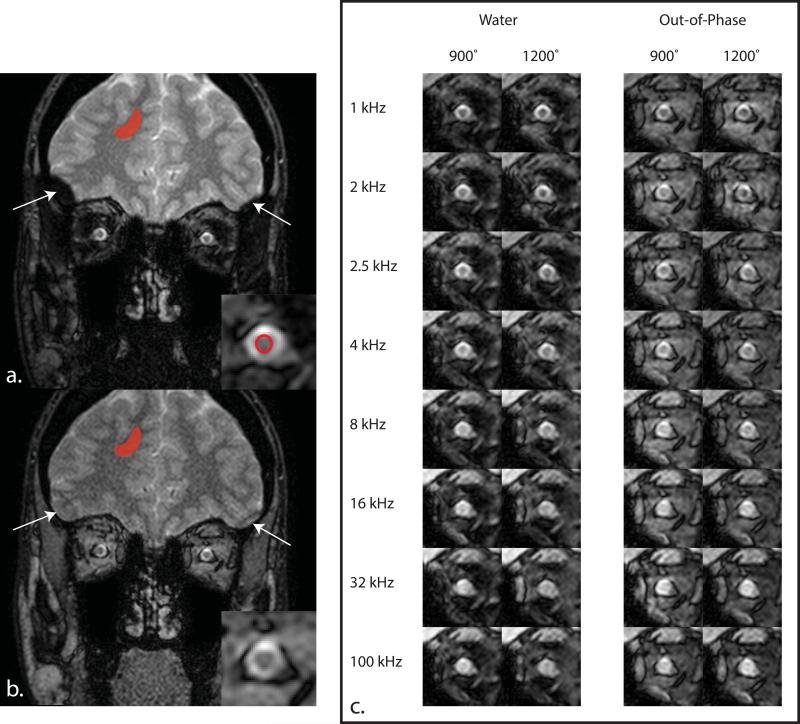
Panels (a.) and (b.) illustrate the MT effect at 1000 kHz with a saturation power of 900° for the (a.) water and (b.) out-of-phase images for a slice immediately posterior to the globe (proximal retrobulbar). The cutoff area of the brain on the outer edges of the volume in the water image is indicative of poor shimming in these regions, and thus, a mislabeling effect of the Dixon method (see arrows). The ROIs in (a.) and (b.) display the area used to compare the water and out-of-phase qMT parameters in the brain and optic nerve. The optic nerve ROI in (a.) is propagated to (b.) for analysis in the out-of-phase images. (c) Example MT-weighted data in the optic nerve for the water and out-of-phase images. Notice the increased conspicuity of the optic nerve against the surrounding tissue in the water images compared to the out-of-phase images.

