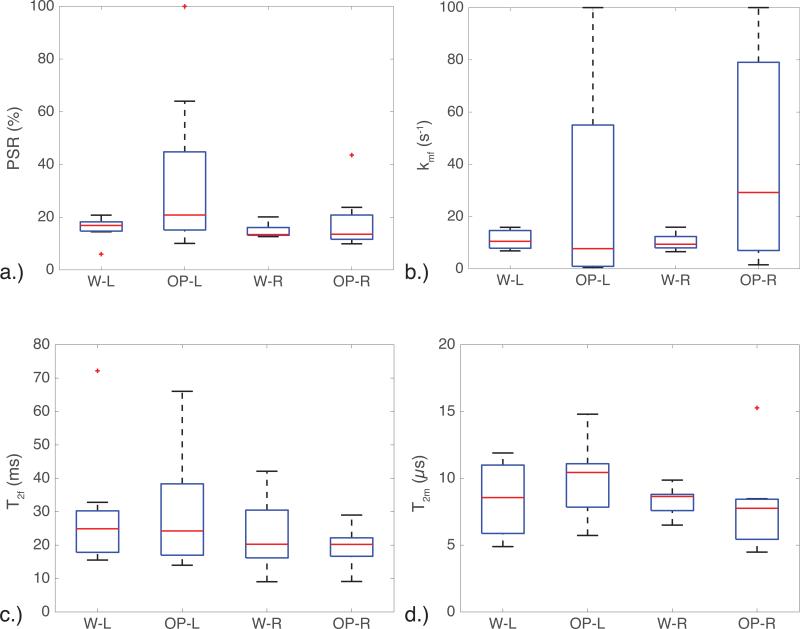
Figure 5.
Box plots illustrating the variance in the a.) PSR, b.) kmf, c.) T2f, and d.) T2m for the left (L) and right (R) optic nerves in both the water (W) and out-of-phase (OP) images. The kmf shows a large amount of variation in the OP images, and small variation in the W images. A similar trend is seen in the PSR, indicating that the two-pool qMT model used here did not fit the OP data well.

