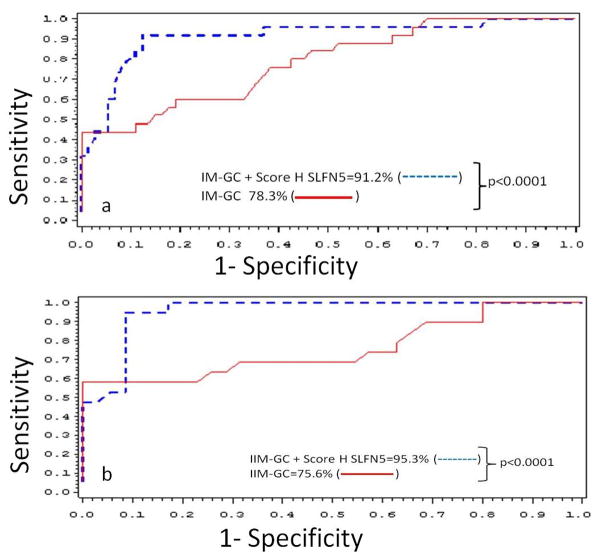
Fig. 6.
ROC curves for logistic regression models of IM (A) and IIM (B) with or without the SLFN5 stromal score.
Logistic regression models were constructed with histological diagnosis, sex, age and with or without categorized SLFN5 stromal score H, as variables. p-value of the Log-likelihood ratio test between the score with versus without the stromal score is indicated for each model. (
 ). Model with SLFN5 stromal score. (
 ). Model without the SLFN5 stromal score. AUC values are also shown as percentages.

