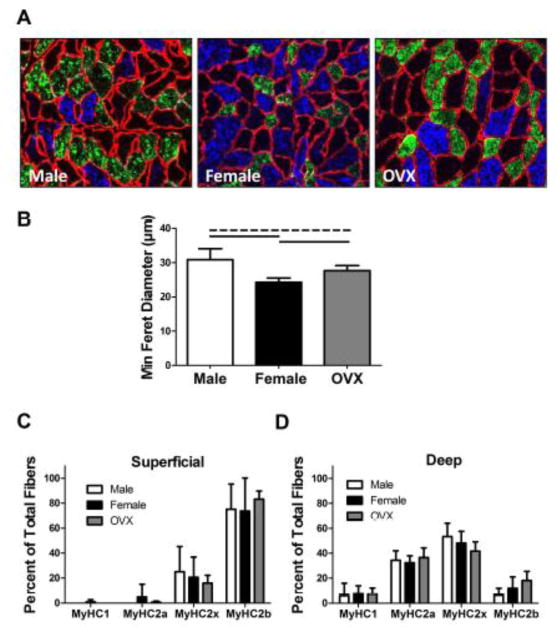
Figure 7 . Muscle Fiber Size and Type Distribution.
(A) Representative images displaying muscle fiber size (fiber membrane shown in red by fluorescent tagging of laminin). (B) Fiber size was increased in males compared to females (significant) and OVX (trend). Additionally, OVX animals demonstrated greater fiber size than females. Fiber types were determined by fluorescent tagging of myosin heavy chain (MyHC) types 1, 2a, and 2b. MyHC type 2x expression was presumed from unstained fibers. Fiber type distribution was similar between groups in both the (C) superficial and (D) deep regions of the muscle. However, more type 2b (fast-twitch glycolytic) fibers were evident in the superficial region and more type 2a (fast-twitch oxidative) fibers were evident in the deep region for all groups.
*Data represented as means and error bars indicating standard deviation. Solid lines indicate significant differences (p<0.05/3) and dashed lines indicate trends (p<0.10).

