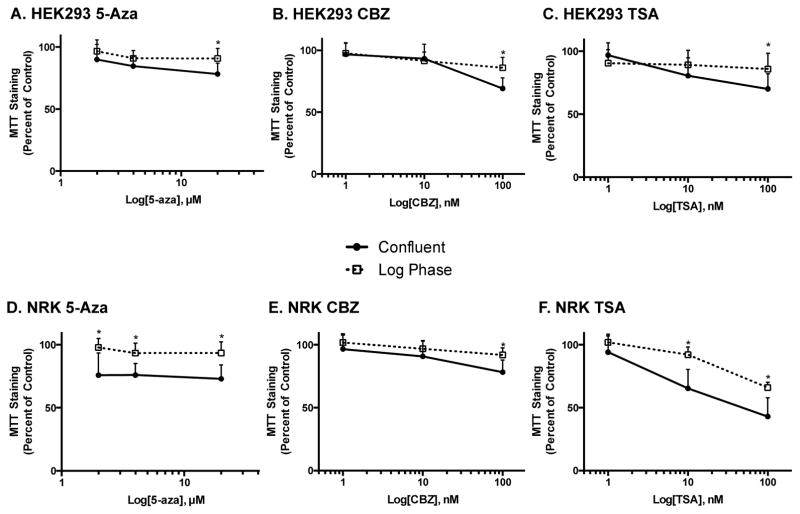
Figure 6.
Effect of the stage of cell growth on epigenetic inhibitor-induced toxicity in kidney cells. HEK293 (A–C) and NRK cells (D–F) were treated with epigenetic inhibitors after 24 hr (Log Phase; open squares) or 48 hr of growth (Confluent; closed circles) and the difference observed using MTT staining. Data are indicative of results from 6 separate passages per cell line (n ≥ 6) and are expressed as mean ± SD. (* p < 0.05 compared to Confluent by One-way ANOVA followed by Bonferonni post-hoc test)

