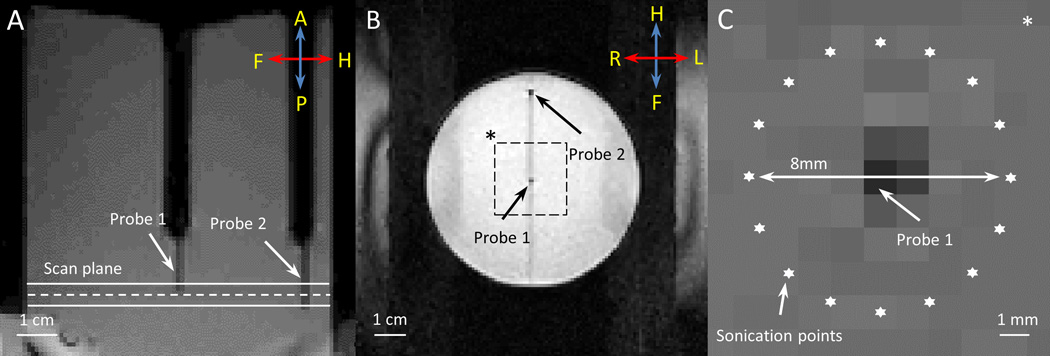
Fig. 2.
T1-weighted images acquired along (A) and across (B) the ultrasound beam. Two fiber-optic temperature probes were used to validate MR thermometry during MR-HIFU hyperthermia exposures in a phantom. The dashed line in (A) depicts the center of the plane where MR thermometry was performed during heating. The locations of two temperature probes are shown in (B). Zoomed-in view of the dashed square region in (B) is shown in (C), with the precise location of heating. The ultrasound beam was rapidly scanned along an 8 mm circular trajectory resulting in a uniform region of heating around Probe 1.

