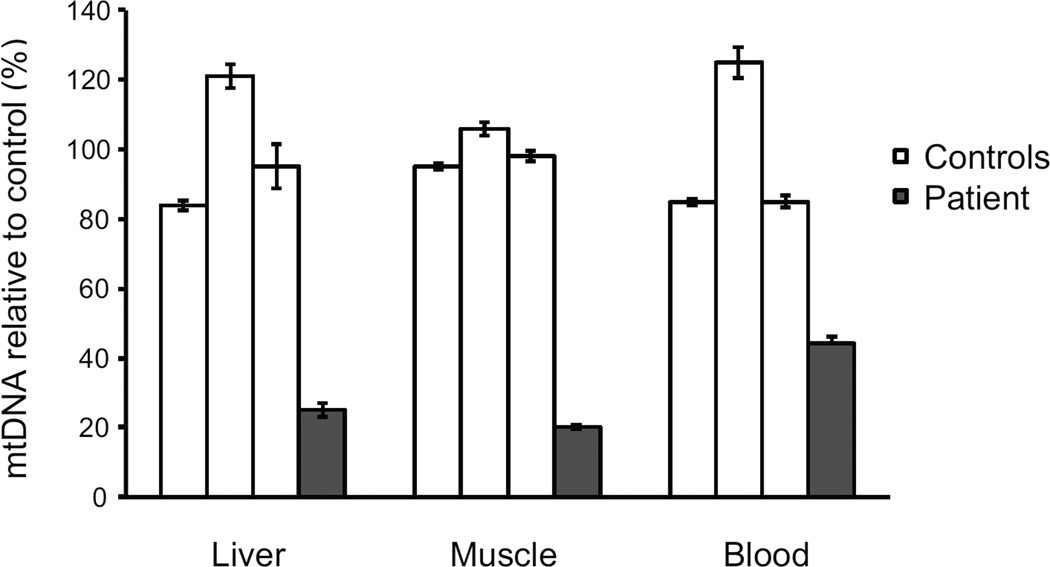
Figure 2.
Mitochondrial DNA depletion in various tissues. Mitochondrial DNA levels were measured by Multiplex Real-time PCR in liver and muscle (frozen tissue) and blood lymphocytes. The mean mtDNA levels of the 3 control samples was set as 100%. The relative mtDNA levels are expressed as mean +/− SEM for each control and patient sample, each sample was tested in triplicate.

