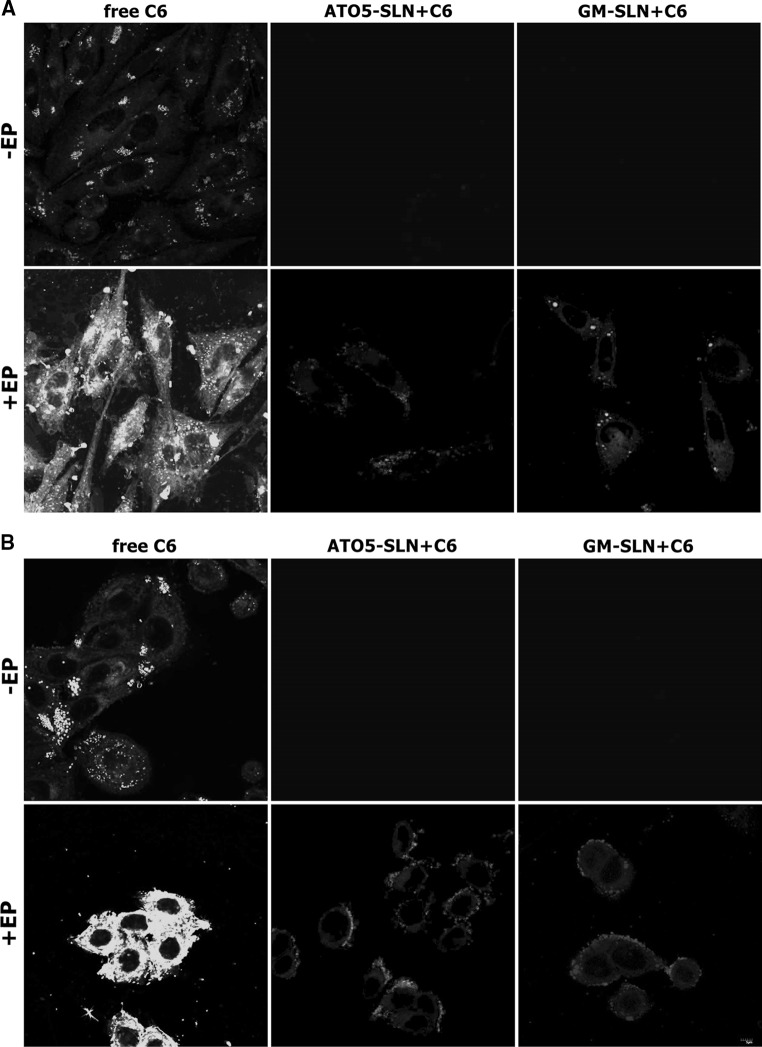
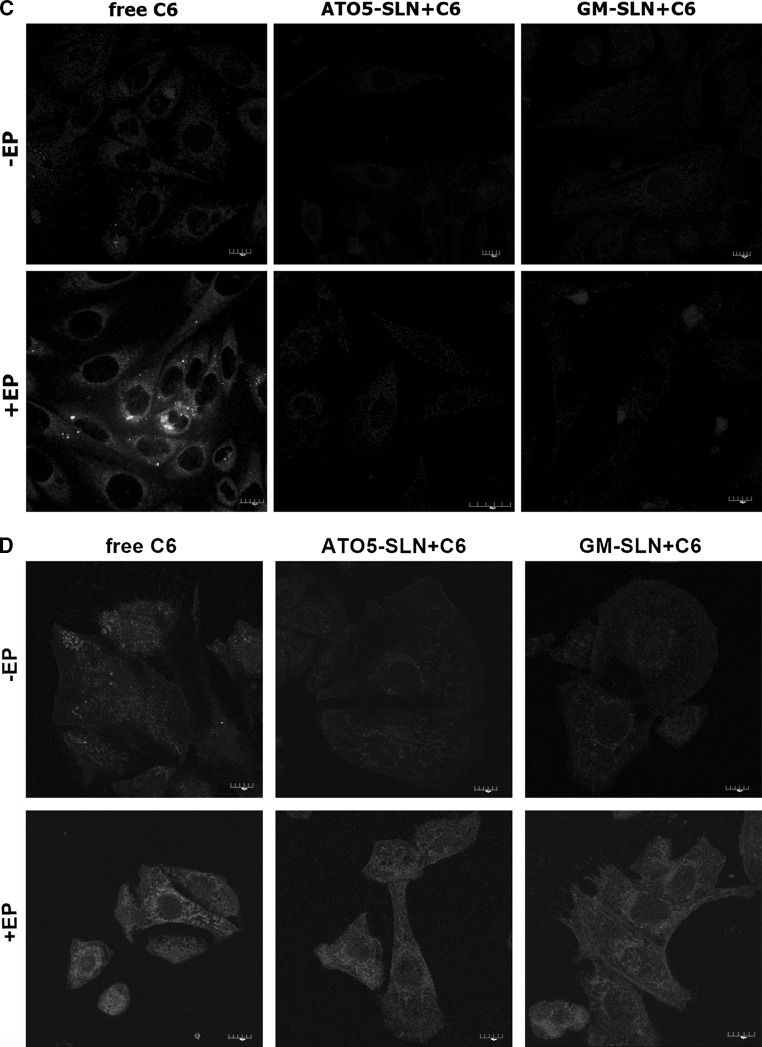
Fig. 7.
The evaluation C6 distribution in the cells using CLSM analysis. C6-loaded in nanoparticles (GM-SLN and ATO5-SLN) added before EP at 500 V/cm (5 pulses, 1.5 ms each) or no electroporation applied. Images obtained 10 min after the procedure: a CHO-K1 cells and b LoVo cells; and images obtained 24 h after the procedure: c CHO-K1 cells and d LoVo cells


