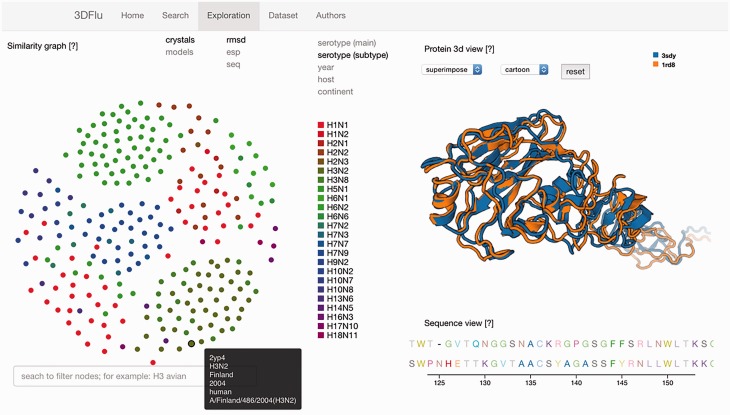
Figure 1.
The exploration window of the database web visualization. The window includes several panels: on the left the network representation of the protein distances (ESP, RMSD, sequence similarity) with the search field; on the right the structure visualization (top) and the sequence (bottom) of the user-selected entries.

