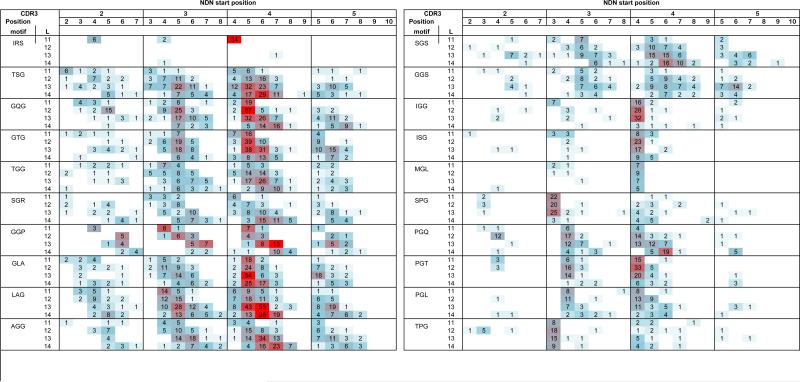
Figure 3. Triplet motif distributions.
The number of observations of clonotypes encoding the identified NDN doublet motif is shown. The motif is identified in the left column. The data for the different CDR3 lengths are stacked for each motif. The shading represents the relative frequency with respect to other motifs at that length.

