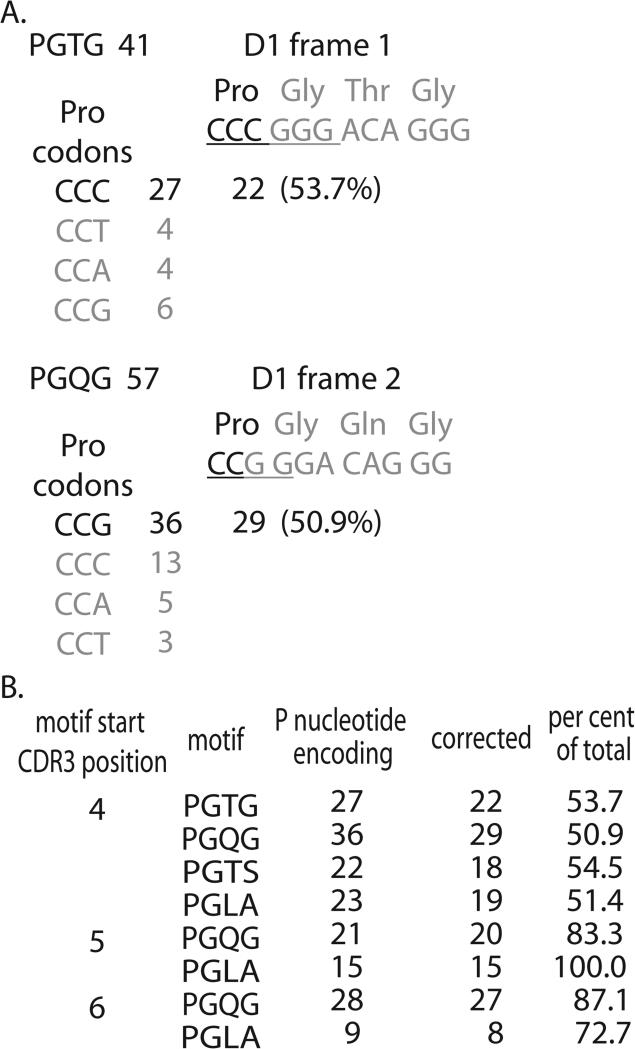
Figure 5. Amino acid encoding data for D-region containing motifs starting with a proline.
A. The analysis of the two motifs derived from D1 for motifs starting at CDR3 position 4 is shown in detail. The PTGT motif was observed 41 times. The encoding expected of a P-loop mechanism (dark font) and the D region is shown with the palindromic nucleotides underlined. The Pro codon usage is shown with the data for the codon expected from the P-loop mechanism in the darker font. The average of the three non-p-loop examples is used to estimate a background, and this is subtracted from the candidate encoding to provide a corrected estimation of the p-loop contribution. The corrected number is shown and used to calculate the percentage of PGTG motifs generated by the mechanism. A similar example is shown for the PGQG motif. B. Summary of data for motifs appearing at three CDR3 positions. PGTG and PGTS frequencies at CDR3 positions 5 and 6 were too low for analysis.

