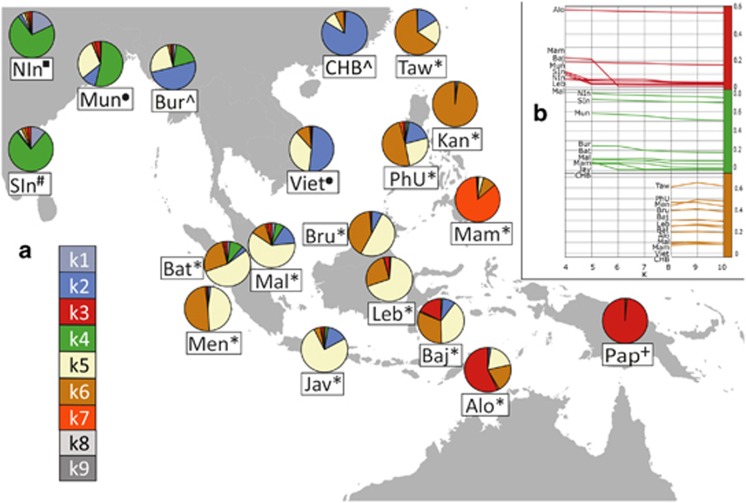
Figure 1.
(a) A map of Southeast Asia, displaying a subset of populations assessed in this study and the distribution of ancestry components based on the local ADMIXTURE run with the optimal number of ancestry components (K=9, cf. Supplementary Figure S2). The figure legend on the lower left section shows the list of genetic ancestry components whose colour codes correspond to those on the pie charts. Components k8 and k9 are mainly present in the Yoruba and Ati Negritos, respectively, and do not significantly contribute to the genetic diversity of the groups displayed in Figure 1. The population abbreviations are as follows: Alo-Alorese, Baj-Bajo, Bat-Batak, Bru-Brunei (Dusun, Murut), Bur- Burmese, CHB-Chinese from Beijing, Jav-Javanese, Kan-Kankanaey Igorots, Leb-Lebbo, Mal-Malay, Mam-Mamanwa Negritos, Men-Mentawai, Mun-Mundari, NIn-North Indians, Pap-Papuans, PhU-Philippine Urban, SIn-South Indians, Taw-Ami and Atayal from Taiwan, Viet-Vietnamese. Note that the symbols next to the population names reflect the linguistic affiliations. Austroasiatic languages: circle, Austronesian languages: asterisk, Indo-European languages: square, Dravidian languages: hash, Papuan languages: cross, Tibeto-Burman languages: caret. (b) Three graphs showing the proportions of ancestry components k3, k4 and k6 from their emergence as independent components in the Papuans (k3, red), Indian populations (k4, green) and the Kankanaey Igorot (k6, brown) across multiple higher K values. All populations displayed show a percentage of at least 5% of the respective ancestry when it emerges.

