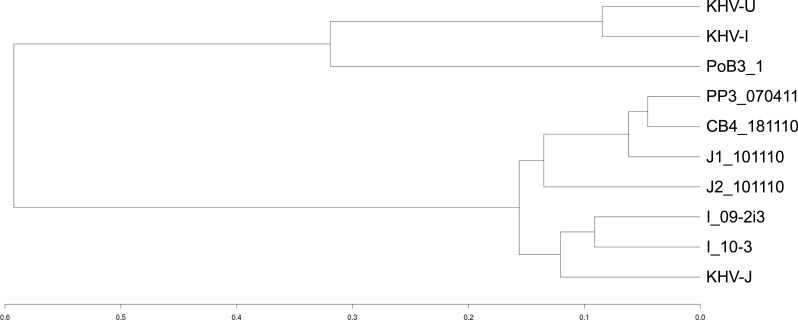
Figure 4. Genetic distances between CyHV-3 specimens.
A distance matrix between samples was first computed using an Identity By State (IBS) distance. Specimens were then grouped into clusters using the R package hclust and the corresponding dendrogram plotted. The scale represents the maximum IBS-distance between two elements of linked clusters (branches in the tree).

