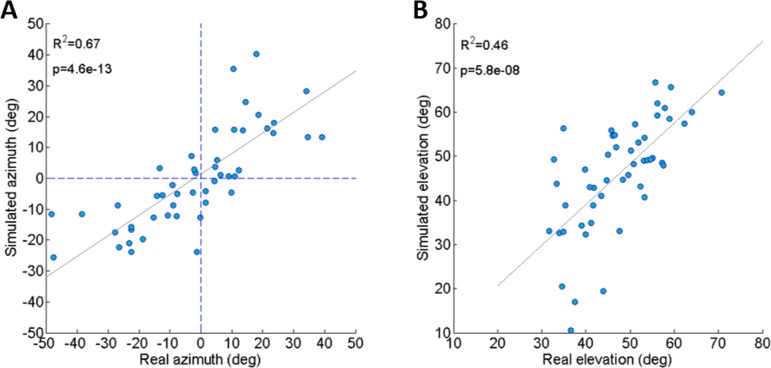
Figure 3. Comparing real and simulated jumps.
(A) Comparison between the azimuth of real jumps and the azimuth predicted by our simulations. (B) Comparison between the elevation of real jumps and the elevation predicted by our simulations. Solid lines indicate linear regression (Analysis of variance of linear model, F-test).

