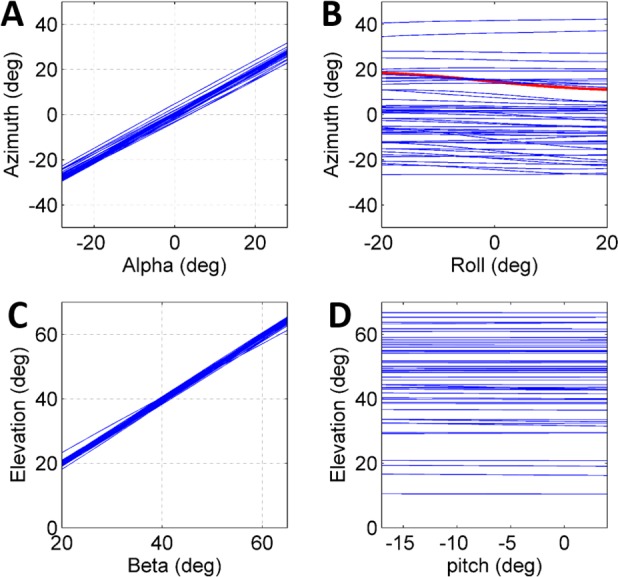
Figure 4. The effect of initial conditions on the jump trajectory.

Each graph presents data based on 33 sets of simulated jumps. Each simulation set was based on data obtained from a specific real jump. In every graph one coordinate was manipulated through its typical operational range to quantify its effect on jump azimuth or elevation: (A) Alpha; (B) Roll; (C) Beta; and (D) Pitch. One simulation set in (B) in which changes in roll led to a change of ±4° in azimuth is marked in red.
