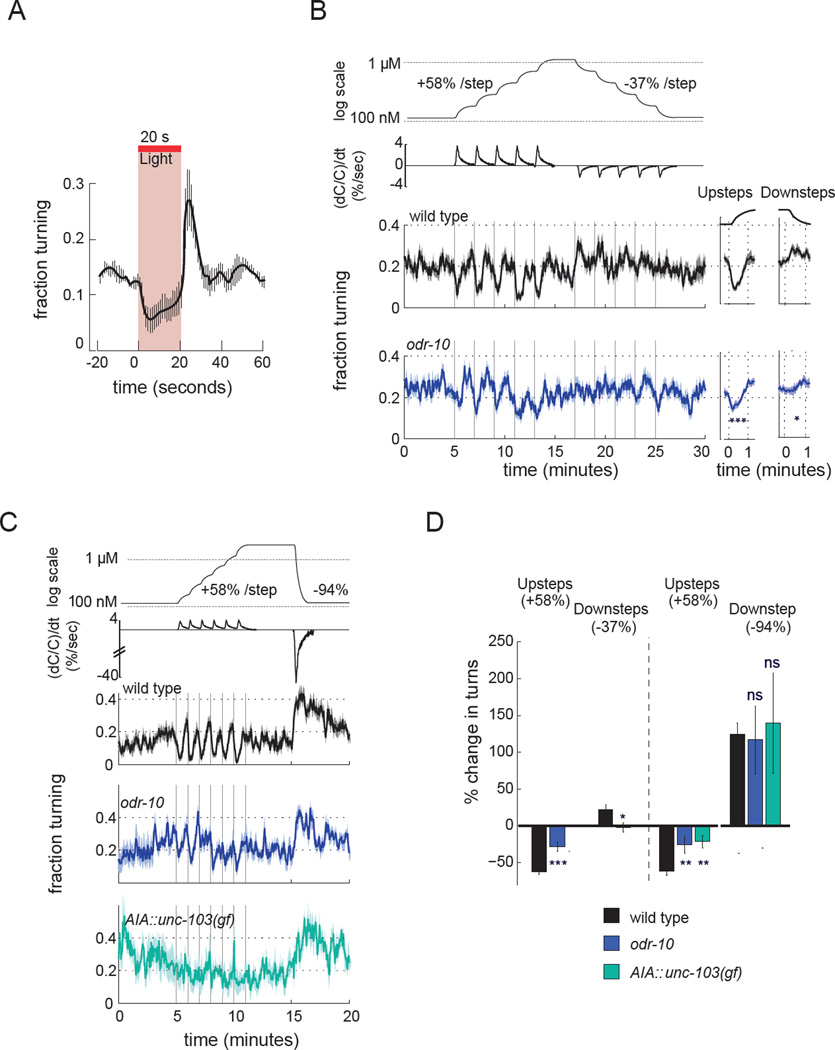
Figure 7. AWA and AIA drive behavioral responses to small diacetyl increases.
a) Behavior of animals expressing Chrimson in AWA during and after 20 s of light stimulation. Animals were filmed as they moved freely on agar plates, and instantaneous turning frequencies (encompassing reversals and omega turns) were scored automatically in 1 s time bins. Error bars represent s.e.m. n = 3 experiments, 15–20 animals each.
b) Behavioral responses of freely-moving animals to fold-change odor increases and decreases, delivered once per minute in microfluidic arenas. Odor concentrations (shown on log scale) and the change in relative odor concentration over time, (dC/C)/dt are shown at top; fold-changes result in a constant (dC/C)/dt. Instantaneous fraction of wild-type and odr-10 animals turning during the diacetyl stimulation protocol is shown at bottom. At right, average response over all fold-change steps. A 58% increase corresponds to a 37% decrease per step. Shading represents s.e.m. n=8 assays with 20–30 animals per genotype, 2 repeats per assay. ***, different from wild-type at P<0.001; *, different from wild-type at P<0.05.
c) Behavioral responses of freely-moving animals to 58% fold-change odor increases and a large 94% step decrease. Odor concentrations and dC/dt are shown at top. Data show instantaneous fraction of animals turning during the diacetyl stimulation protocol. n=4–10 assays with 20–30 animals per genotype.
d) Suppression of turning during 58% upsteps and enhancement during large but not small downsteps in experiments in (b) and (c). Bars represent the average change in peak response over all fold-change increases or decreases. Error bars represent s.e.m. *P<0.05; **P<0.01;***P<0.001 compared to wild type; ns not significant.

