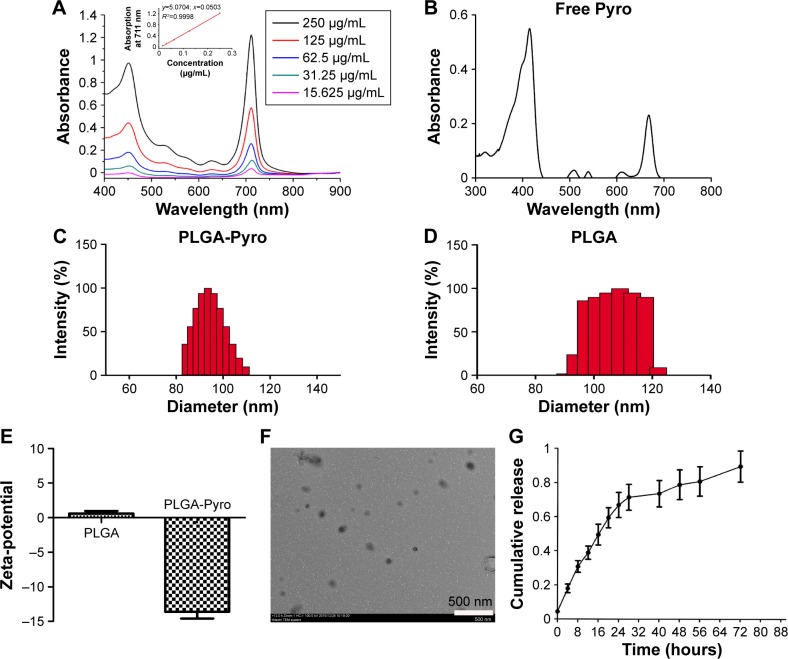
Figure 1.
Characterization of Pyro-loaded PEG-PLGA NPs.
Notes: (A) Absorption spectra of various concentrations of NPs in PBS. The inset plots are Q-band absorbance versus the concentration of the corresponding compounds. (B) Absorption spectrum of free Pyro. (C) DLS measurement of Pyro-loaded NPs. (D) DLS measurement of the empty NPs. (E) Zeta-potential of Pyro-loaded NPs and empty NPs. (F) TEM image of the NPs. (G) Pyro-release profile of the NPs.
Abbreviations: Pyro, pyropheophorbide-a; PEG, polyethylene glycol; PLGA, poly(lactic-co-glycolic acid); NPs, nanoparticles; PBS, phosphate-buffered saline; DLS, dynamic light scattering; TEM, transmission electron microscopy.

