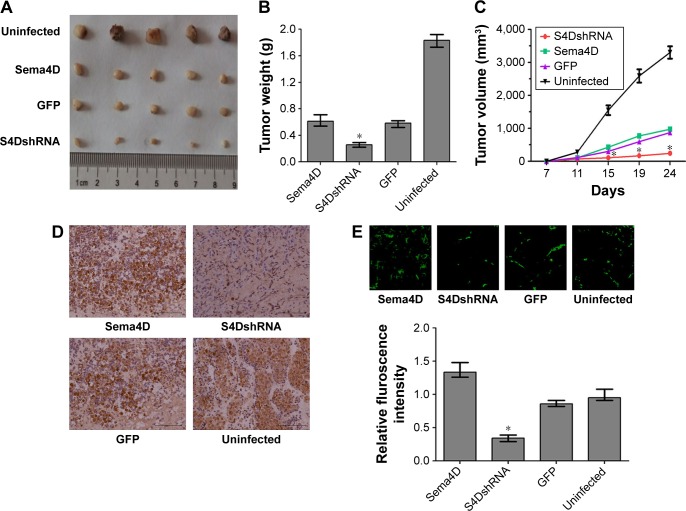
Figure 7.
Results of an in vivo tumorigenesis assay for MDA-MB-231 cells.
Notes: Cells were treated in four different groups, uninfected or infected with the indicated lentivirus: a control lentivirus-expressing GFP, a Sema4D-coding lentivirus, or a lentivirus coding for Sema4D shRNA. Cells from the four groups were injected subcutaneously into nude mice along with basement membrane matrix. (A) MDA-MB-231 xenografts were infected by the indicated lentiviruses. (B) Tumor weights in the four groups of MDA-MB-231 cells are shown as a bar graph (n=5; *P<0.05, relative to both the uninfected and GFP groups). Bars indicate the means of five tumor weights ± standard errors. (C) Tumor growth curve for the four groups of MDA-MB-231 cells and tumor volume measurements (mm3) are shown, (n=5; *P<0.05, relative to both the uninfected and GFP groups). (D) Immunohistochemical measurements of Sema4D in tumor tissues harvested from the four indicated groups. Clear differences in Sema4D expression were found among the four indicated groups. (E) CD31 immunofluorescence staining for the evaluation of vascular density; CD31 immunofluorescence staining of frozen section of tumors derived from the four indicated groups is shown here. The bar graphs show the vascular contents of these tumors, which were determined based on the average vessel density in five CD31-stained sections from each group (n=5; *P<0.05, relative to both the uninfected and GFP groups). Bars indicate means of vessel density in ten CD31-stained sections ± standard errors. Scale bars =100 μm.
Abbreviations: Sema4D, semaphorin 4D; shRNA, short hairpin RNA.

