
Figure 4.
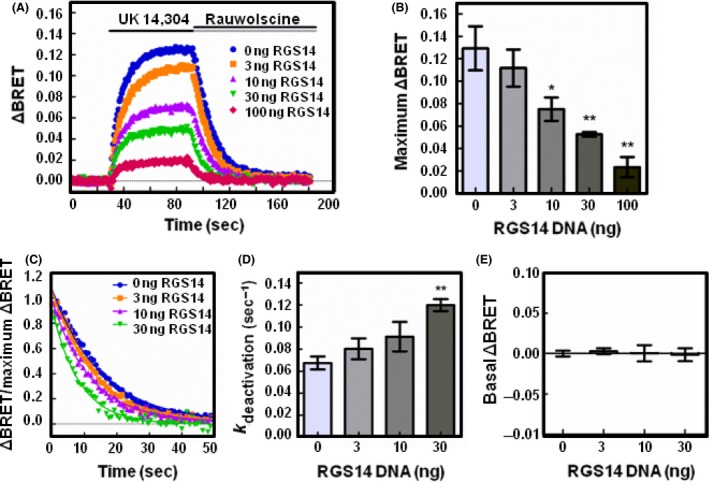
RGS14 expression reduces the release of free Gβγ and accelerates the deactivation of Gαo proteins following receptor activation. (A) HEK 293 cells were transfected with 200 ng of α2A‐adrenergic receptor, 200 ng of Venus‐Gβ1, 200 ng of Venus‐Gγ2, 25 ng of mas‐GRK3ct‐Luc, and 400 ng of Gαo and monitored for kinetic BRET as in Figure 1. Average whole traces of BRET signal over time are shown from cells expressing Gαo alone and 3, 10, 30, or 100 ng of FLAG‐RGS14 (n = 3). (B) Maximum ΔBRET observed from data presented in (A). (C) Deactivation curves normalized to maximum ΔBRET and fit using a single exponential decay function. (D) Deactivation rates (k deactivation) determined from curves fit in (C). (E) Average BRET measured for 30 sec at baseline, prior to agonist stimulation. Error bars represent ± S.E. Statistical analysis was performed using a one‐way analysis of variance (ANOVA) with Tukey's post hoc test (*P < 0.05, **P < 0.01).