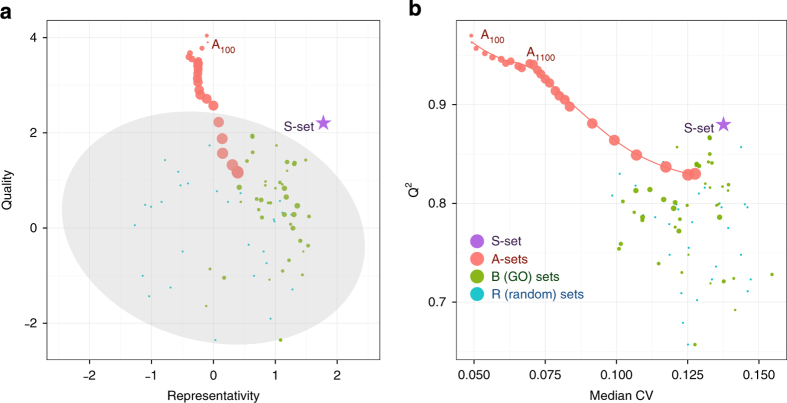
Figure 3.
Quality and representativity of OPLS-DA models for different sets of proteins trained on proteomics data from H1299 cells treated with five drugs. (a) Normalized quality and representativity of different sets of proteins. The 95% confidence area for random sets is shown in gray. The circle sizes are proportional to the sizes of the protein sets. (b) Scatter plot of the OPLS-DA models’ Q2 values versus the median CV of protein abundances used in the model.

