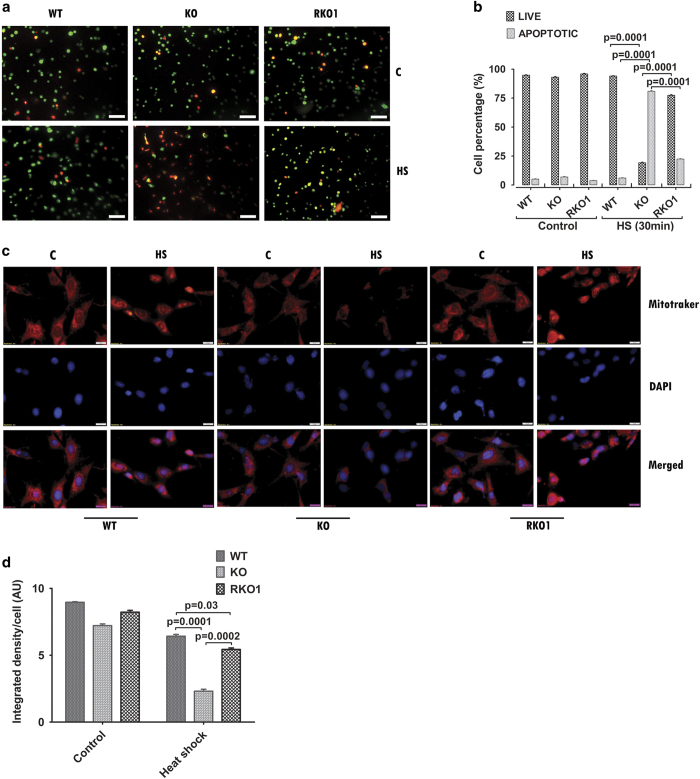
Figure 2.
Loss of arginylation increased apoptosis in MEFs upon heat stress. (a) Fluorescence micrographs of acridine orange/ethidium bromide (AO/EB) stained cells after heat shock at 44 °C for 30 min followed by recovery for 8 h at 37 °C (HS). Control cells (C) were incubated at 37 °C. Scale bars, 100 μm. (b) Graph represents of percentage of apoptotic (orange/red) and live (green/light yellow) cells in control (C) and heat-shocked (HS) cells in the experiment described in a. Data represent average of four frames. Total number of cells counted for analysis were WT: 486 (C), 511(HS), KO: 487(C), 507 (HS), and RKO1: 523(C), 426 (HS). (c) Fluorescence micrographs of mitochondrial membrane potential-dependent mitochondrial dye, MitoTracker Orange CMTMRos (300 nM), stained cells after heat shock (HS) at 44 °C for 30 min followed by recovery of 6 h at 37 °C. Control (C) cell were incubated at 37 °C. Nuclei were stained with DAPI. Scale bars, 20 μm. (d) Graph represents quantification of the data described in c. Average ‘integrated fluorescence density’ per cell in control and heat-shock conditions are plotted for WT, KO, and RKO1 cells. Data represent average of four frames. Total number of cells counted for analysis were, WT: 18 (C), 38 (HS), KO: 38(C), 43(HS), and RKO1: 27(C), 38(HS). Data represent mean±s.e.m. P-values: Student's t-test.

