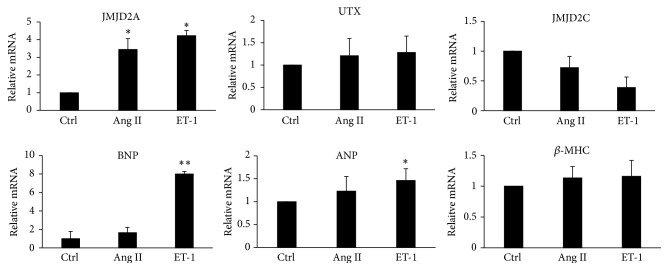
Figure 1.
The quantitative analysis of JMJD2A, UTX, BNP, ANP, β-MHC, and JMJD2C expression in cardiomyocytes. Cq values of Q-PCR analysis were normalized against GAPDH. The data are presented as the mean ± SEM from at least three independent experiments. ∗ p < 0.05 compared with the control. ∗∗ p < 0.01 compared with the control.

