FIGURE 7.
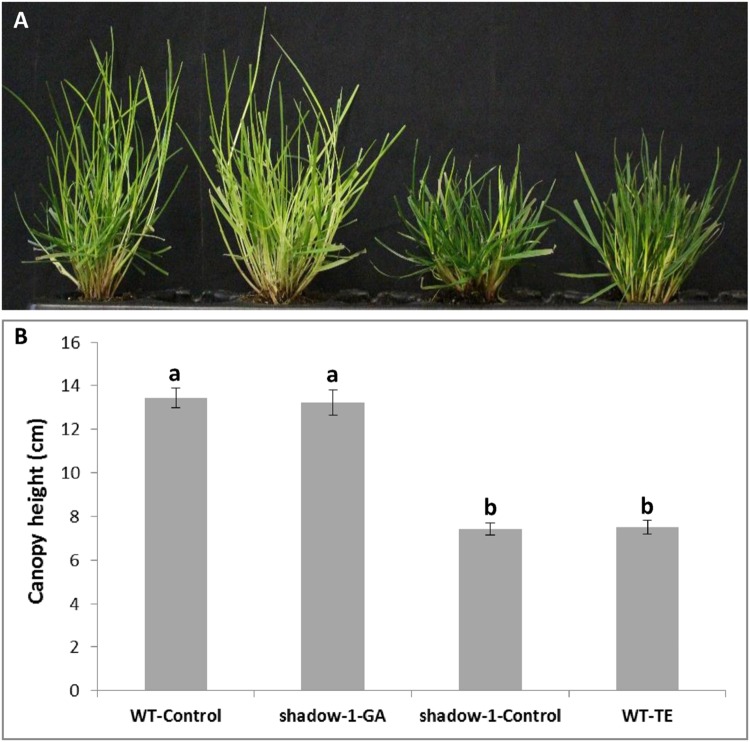
Applications of gibberellic acid (GA3) to shadow-1 and TE to WT demonstrate a link between shade tolerance and GA. (A) Untreated WT (far left), GA3-treated shadow-1 (center left), untreated shadow-1 (center right), and TE-treated WT (far right) after 2 weeks under 95% artificial shade. (B) Canopy height comparisons between all lines and treatments shown in (A). Plants were allowed to grow in full light for 3 weeks after chemical application before they were placed under artificial shade. All photographs were taken 2 weeks after shade treatment. Data represent the average of six replicates. Each replicate consisted of one plant. Bars represent the standard error. Bars with the same letter above them are not significantly different from each other according to Fisher’s protected least significant difference (P = 0.05).

