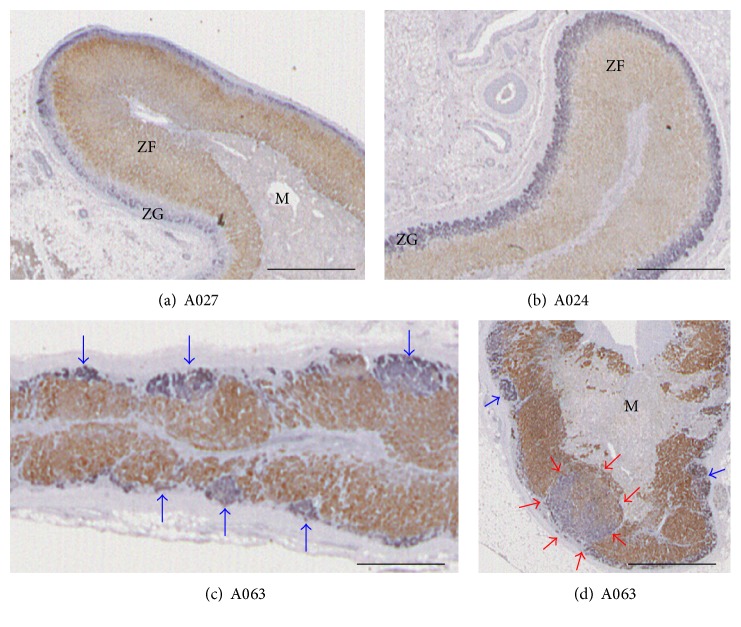
Figure 1.
Double immunohistochemistry for CYP11B2 (blue) and CYP11B1 (brown). (a) Section A027 from Case 7; (b) section A024 from Case 4; (c) section A063 from Case 40; (d) section A063 from Case 40. These are enlarged images of frames in Supplementary Figure 1. Bars indicate 1 mm. Blue and red arrows indicate APCCs and pAATL, respectively.

