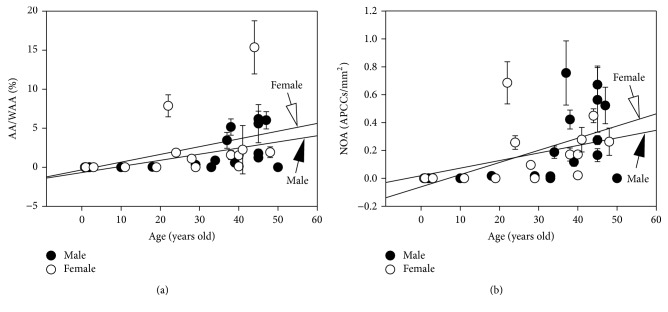
Figure 2.
Relationship between age versus AA/WAA (%, (a)) and age versus NOA (APCCs/mm2, (b)). Error bars indicate SEM between 4 examiners (see Table 1 and Supplementary Table 1). Regression lines of females and males are drawn. AA/WAA: percentage of APCC areas over the whole adrenal area (%). NOA: number of APCCs/mm2.

