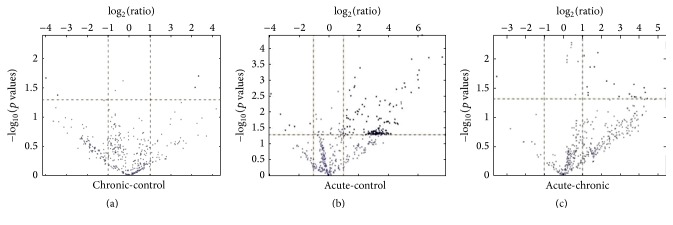
Figure 1.
Differential expressions of miRNAs evaluated in (a) chronic versus control, (b) acute versus control, and (c) chronic versus acute cases depend on mRNA microarray analysis (p < 0.05, cut-off = 2). The volcano plot demonstrates the differential expression of the illustrated genes; dots in light represent genes that did not achieve significant changes in expression, dots in the dark on the left indicate the genes with significantly downregulated expression, and dots in the dark on the right indicate the genes with significantly upregulated expression.

