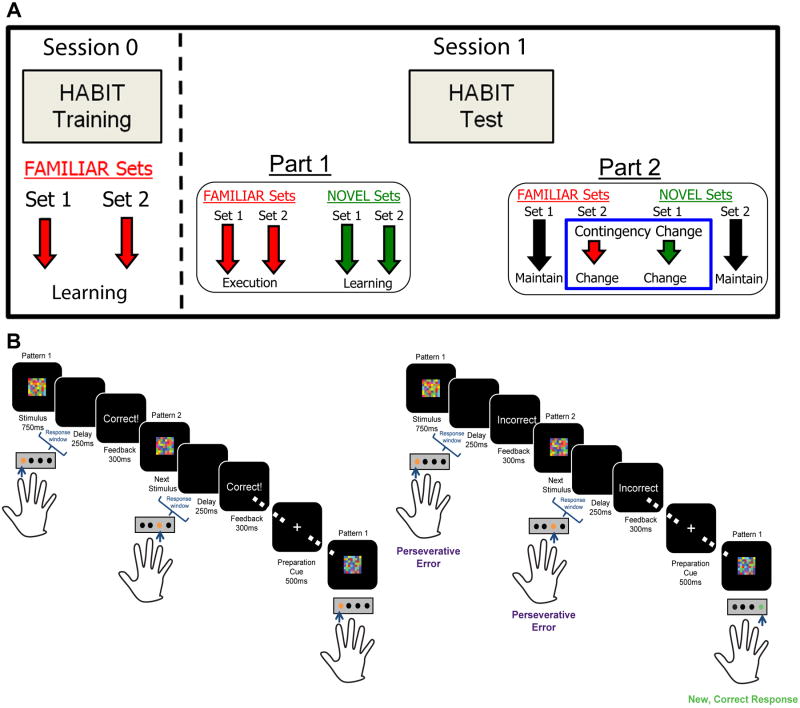
Figure 1. Diagram of HABIT paradigm structure.
(A) Panel depicts training session (“Session 0”) and Test session (“Session 1”), which occurs on a subsequent day. Session 1 is divided into Part 1 (pre-response change; 6 runs) and Part 2 (post-response change; 6 runs). (B) Task schematic for Part 1 (left) and Part 2 (right) of the HABIT Test Session.

