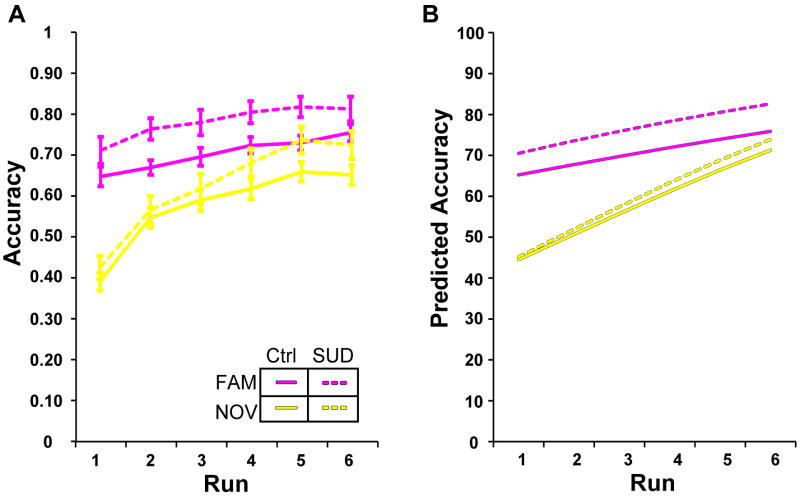
Figure 2. Mean accuracy values during pre-change task performance.
Solid lines represent the control group (Ctrl) and dashed lines represent the SUD history group. Mixed models demonstrated that group status significantly predicts accuracy (Table 2). Familiar (magenta) performance starts high and remains high as performance progresses, with SUD history predicting more accurate execution of S-R associations (Model 2, Table 2). Novel (yellow) set performance improves over time as S-R associations are learned, with no difference between groups in rate of learning (Table 2). (A) Data plots depict raw accuracy values adjusted for Age and IQ; error bars represent within subject standard error of the mean. (B) Corresponding model predicted values.

