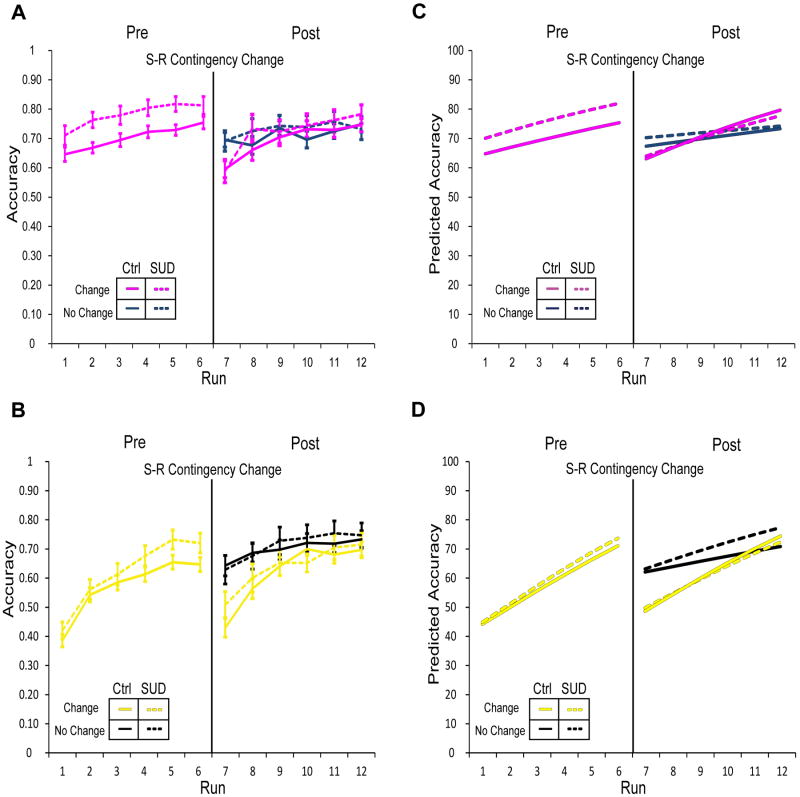
Figure 3. Mean accuracy values during pre- and post-change task performance.
Solid lines represent the control group and dashed lines represent the SUD history group. Overall, a dropoff in performance occurred in blocks with changed response contingencies and performance improved over the course of re-learning (“Post” panels; Table 2); the rate of re-learning compared to the initial (“Pre”) learning rate was dependent upon group status, set-type, and change status (Table 2). (A) Panels depict performance in Familiar sets (magenta) during pre- and post-change. Dark blue lines in the right panel (“Post”) indicate performance in the set with unchanged response contingencies during the re-learning phase; performance in the response-changed set shown in magenta. (B) Performance in Novel sets (yellow) during pre- and post-change. Black lines in the right panel (“Post”) indicate performance in the set with unchanged response contingencies during re-learning; performance in the response-changed set shown in yellow. Performance dropped more dramatically after response change for Novel sets relative to Familiar sets (Table 2). Additionally, the control group showed steeper learning rates for Novel changed sets relative to the SUD group. Corresponding model predicted values are shown in panels C and D.

