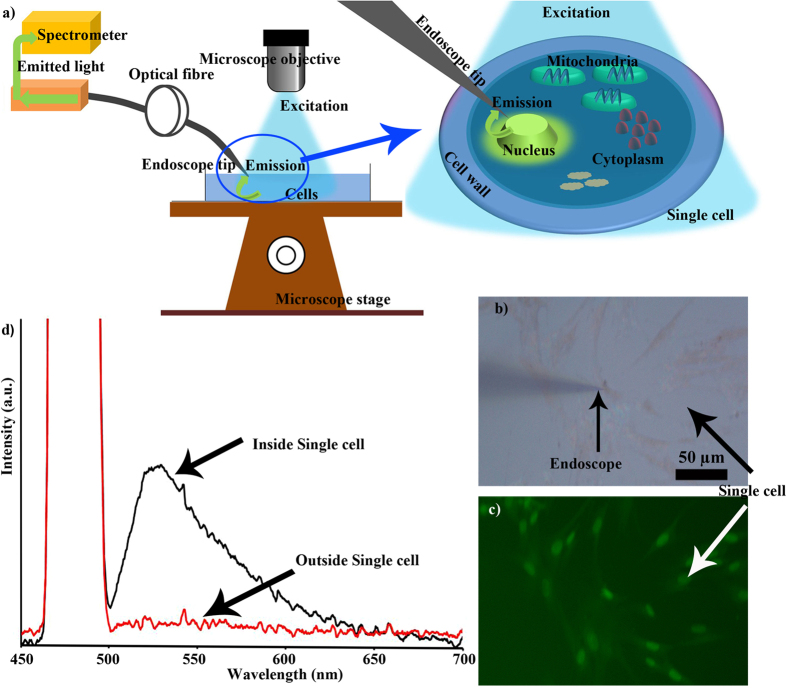
Figure 5. In vitro spectrum collection using nanoendoscope.
(a) Schematics of the experiment where internal microscope light source was used for fluorescence excitation. (b) A bright field image of the nanoendoscope inserted into a fibroblast single cell and (c) the corresponding fluorescence image. (d) The black curve is the spectrum (peak ~525 nm) from a single cell collected using nanoendoscope, while red curve is the spectrum taken outside the cell. The Y axis shows intensity (linear scale).

