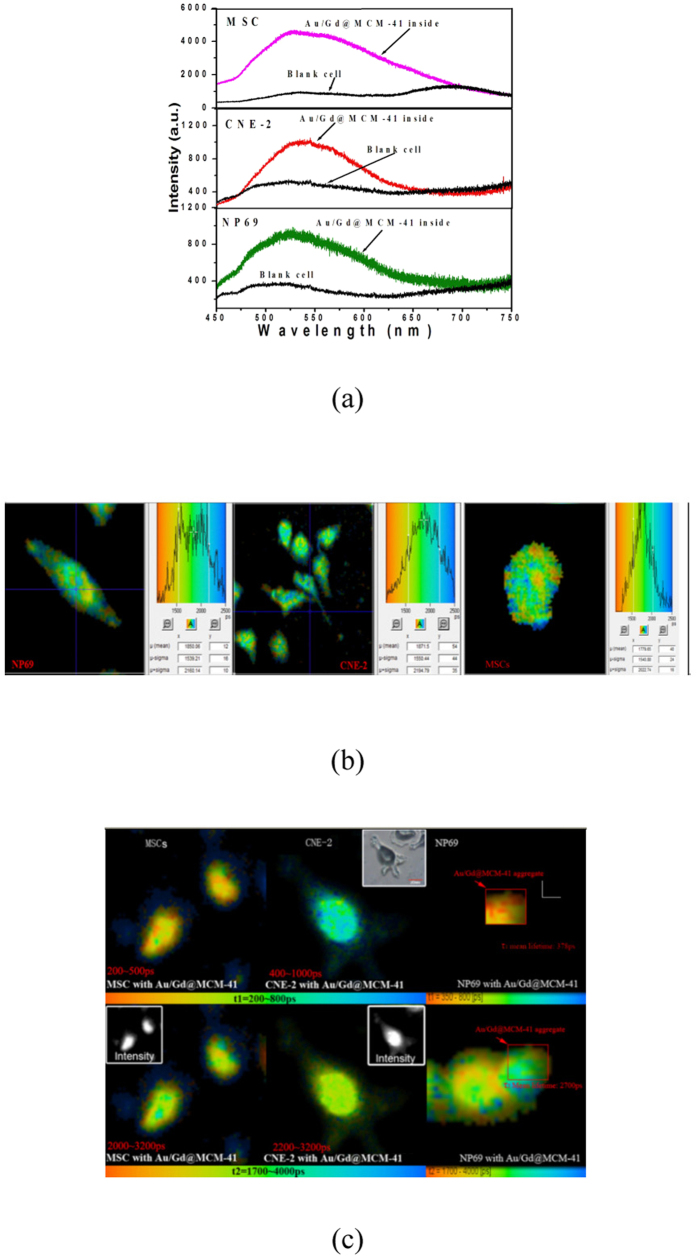
Figure 3.
(a) Autofluorescence (black) and luminescence spectra (colours) after the uptake of Au/Gd@MCM-41 by MSC, CNE-2 and NP69 cells. The excitation wavelength was 400 nm. (b) FLIM autofluorescence images of NP69, CNE-2 and MSC cells (left to right). Excitation wavelength: 400 nm; emission peak: 525 nm. (c) FLIM images of MSC, CNE-2 and NP69 cells after absorbing Au/Gd@MCM-41 (excitation wavelength: 400 nm; emission wavelength: 525 nm). Top: FLIM images of τ1. Bottom: FLIM images of τ2. Insets: luminescence intensity images of MSC and CNE-2 cells.

