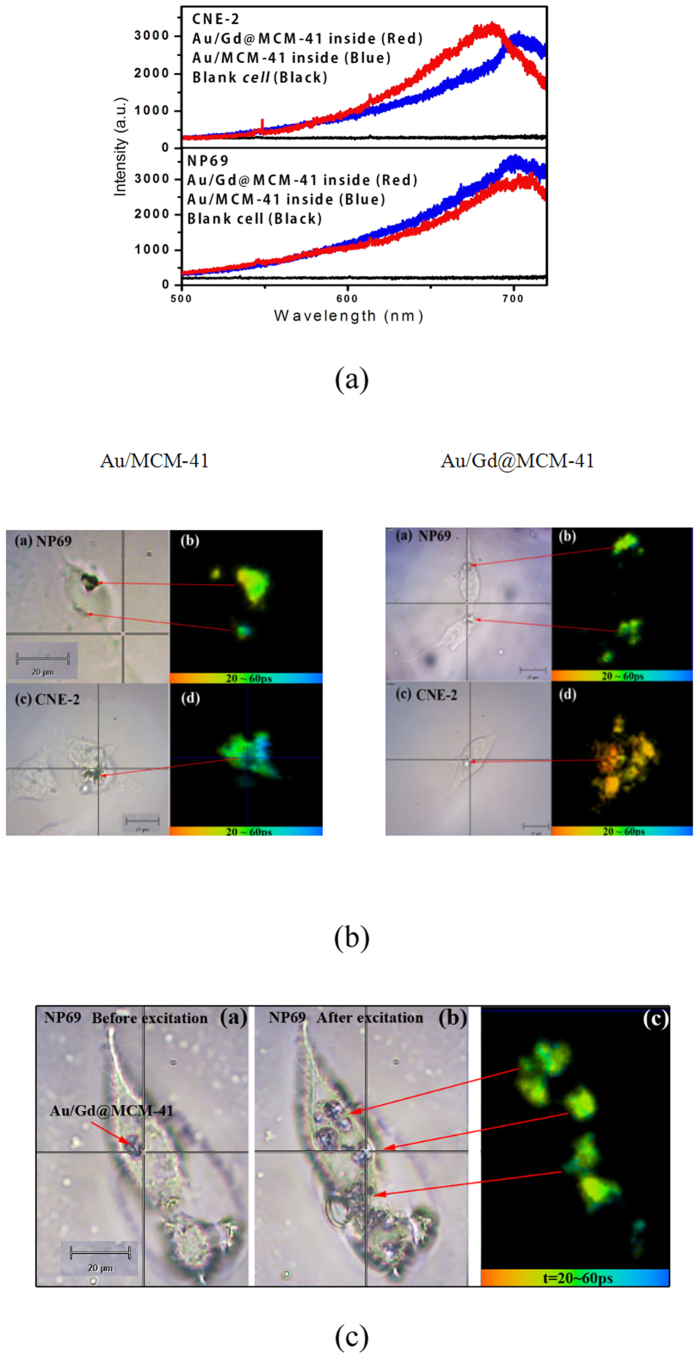
Figure 4.
(a) Luminescence spectra of CNE-2 and NP69 cells excited at 758 nm after the uptake of Au/MCM-41 and Au/Gd@MCM-41. (b) Micrographs of NP69 (a) and CNE-2 (c) cells after the uptake of Au/MCM-41 (left) or Au/Gd@MCM-41 (right). FLIM images of NP69 (b) and CNE-2 (d) cells after the uptake of Au/MCM-41 (left) or Au/Gd@MCM-41 (right). Excitation wavelength: 758 nm; emission wavelength: 690 nm. (c) Au/Gd@MCM-41 nanocomposites aggregate in an NP69 cell after excitation at 758 nm. (a) Optical micrograph of an NP69 cell before excitation. (b) Optical micrograph of an NP69 cell after excitation. (c) FLIM image of Au/Gd@MCM-41 aggregation in an NP69 cell after excitation. Excitation wavelength: 758 nm; emission wavelength: 690 nm.

