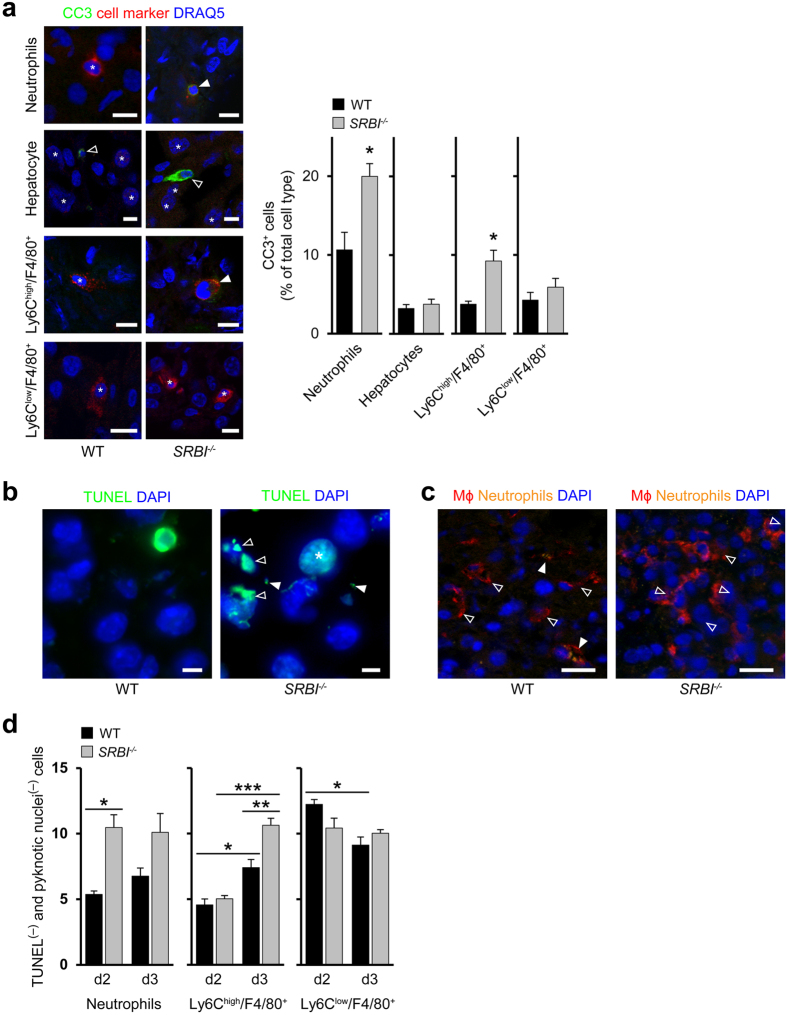
Figure 2. SR-BI suppresses tissue accumulation of neutrophils and inflammatory macrophages.
(a) Visualization of cell type-specific apoptosis. Left: Confocal microscopy images: Full arrowheads, apoptotic cell (colocalization of cell specific marker and CC3+); empty arrowheads, CC3+ cell; star, cell specific marker; Ly6ChighF4/80+, inflammatory macrophages (originating from inflammatory monocytes); Ly6ClowF4/80+, macrophages lacking signs of inflammatory monocytes. DRAQ5, nuclei marker (blue, pseudocolored), Scale bar, 10 μm. Right: Quantification of cells positive for CC3+ (d3) as percentage of total cell type. n = 3, five images per animal. (b) Apoptotic bodies and apoptotic cells with fragmented nuclei during Listeria infection (d3). Confocal microscopy images: Empty arrowheads, apoptotic cells with fragmented nuclei; full arrowheads, apoptotic bodies; stars, apoptotic cells. Scale bar, 10 μm. (c) Macrophages with internalized Ly6G+ neutrophils in the livers of Listeria infected mice (d3). Confocal microscopy images: Empty arrowheads, tissue macrophages; filled arrowheads, tissue macrophages with internalized neutrophils. Scale bar, 20 μm. (d) Number of cells lacking signs of cell death (cell marker+, TUNEL−. normal-sized nuclei) per visual field in Listeria-infected WT and SRBI−/− mice. n = 3, ten images per animal. *P < 0.05, **P < 0.01, ***P < 0.001. t-test (a) and One-way ANOVA with Bonferroni post-test correction (d). Data are representative of experiments on three different mice (a–c).

