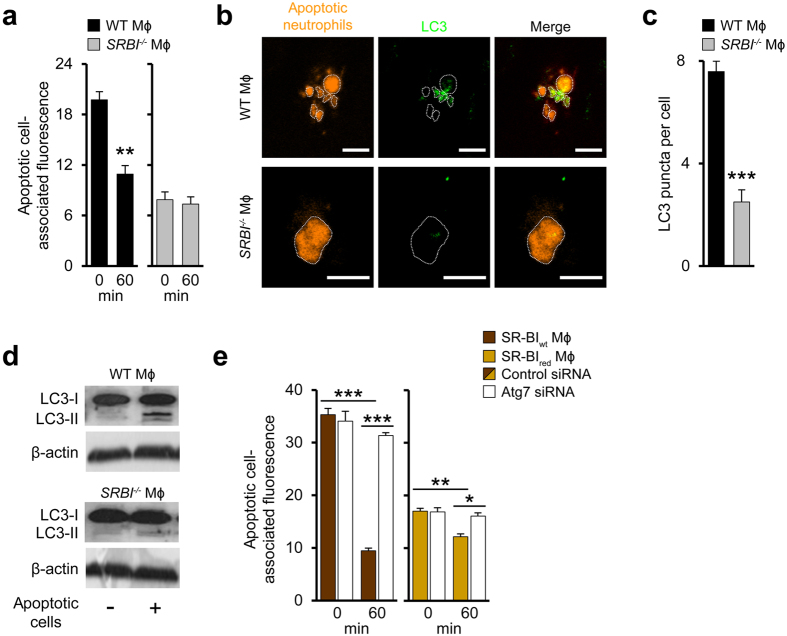
Figure 5. Degradation of host cell and bacterial corpses by scavenger receptor-triggered autophagy.
(a) Degradation of engulfed apoptotic cells in WT (left) and SRBI−/− (right) macrophages. Changes in fluorescence intensity associated with engulfed apoptotic neutrophils. 0 min refers to time point after 30 min engulfment period. n = 3, ten images per experiment. (b) LC3 association with engulfed apoptotic cells in macrophages. Confocal microscopy images: Apoptotic cell structures delineated with dotted lines. Scale bar, 5 μm. Data are representative of three independent experiments. (c) LC3 puncta in macrophages incubated with apoptotic neutrophils. n = 6, ten images per experiment. (d) LC3-II formation in macrophages incubated with apoptotic neutrophils. Representative western blots from three different experiments. (e) Degradation of apoptotic neutrophils in SR-BIwt and SR-BIred macrophages without or with reduced Atg7 expression. Changes in fluorescence intensity associated with engulfed apoptotic neutrophils. 0 min refers to time point after 30 min engulfment period. n = 3, ten images per experiment. *P < 0.05, **P < 0.01, ***P < 0.001. t-test (a,c) and One-way ANOVA with Bonferroni post-test correction (e).

