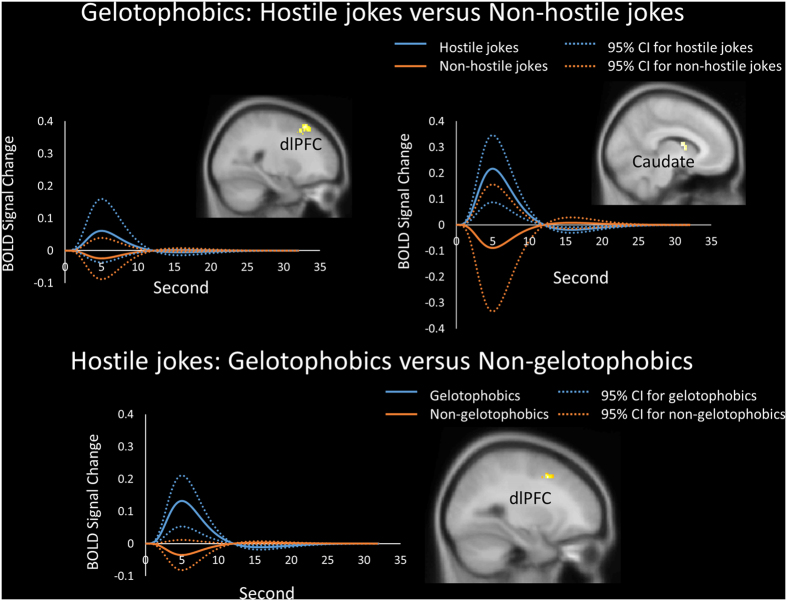
Figure 2. Gelotophobics responding to hostile jokes.
Results showing the time course and average BOLD signals. (Top) Differences in the mean BOLD activation within the clusters across time in response to hostile jokes (blue) versus non-hostile jokes (orange) were found in gelotophobics in the right dorsolateral prefrontal cortex (dlPFC) and left caudate body (dorsal striatum). (Bottom) Gelotophobics (blue) showed greater activation in the left dlPFC than non-gelotophobics did (orange). The solid lines represent the evoked hemodynamic responses. The dotted lines represent the 95% confidence interval (95% CI) for the entire curve.

