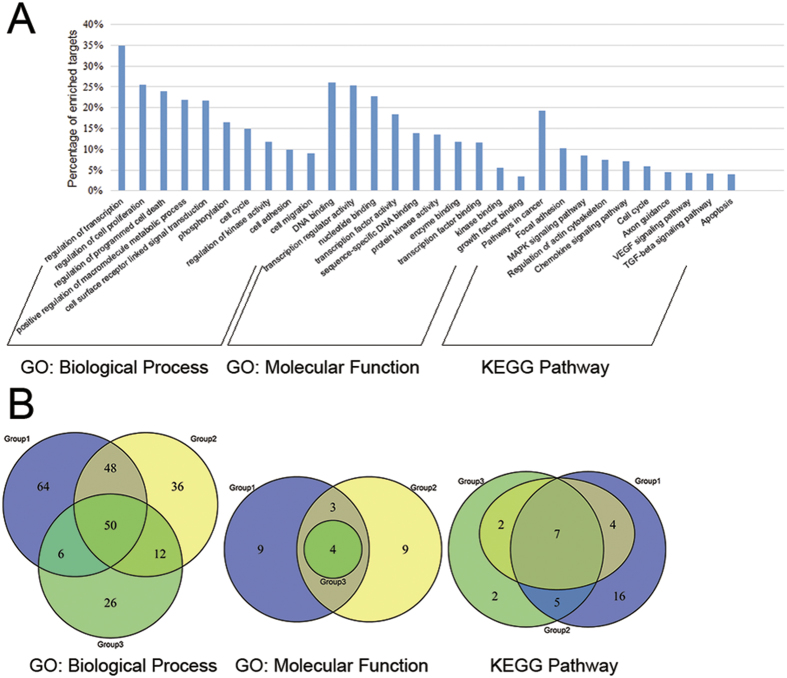
Figure 4. Functional analysis of miRNA targets in CePPIN.
(A) The selected most enriched GO: biological process, GO: molecular function and KEGG pathway terms (p-value < 0.05 and FDR < 0.05) for all miRNA targets. (B) The number and overlaps of GO: biological process, GO: molecular function and KEGG pathway terms (p-value < 0.05 and FDR < 0.05) for miRNA targets in 3 group respectively. The blue, yellow and green circles indicate the terms of Group 1, Group 2 and Group 3 respectively.

