
Figure 2.
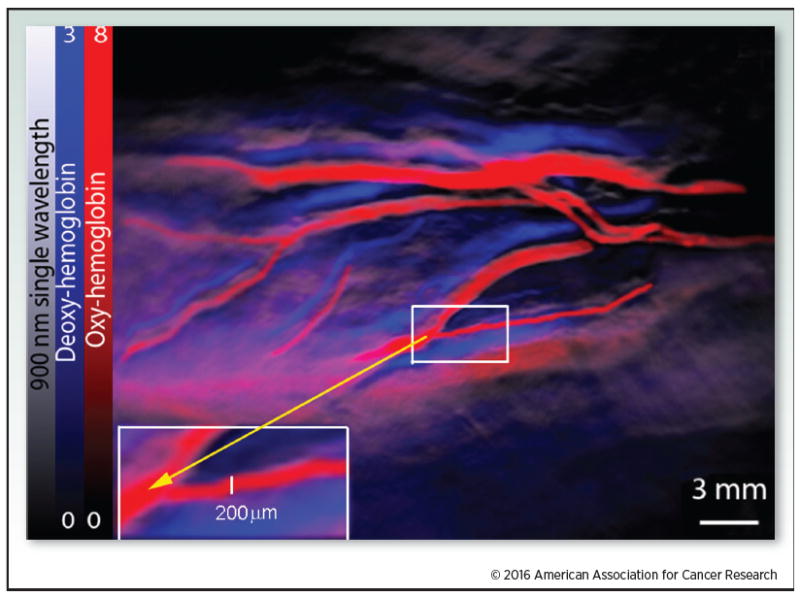
Oxy- and deoxy-hemoglobin were detected using MSOT. Oxy- and deoxyhemoglobin were visualized within a human wrist using a pre-clinical MSOT instrument. The red color bar represents oxyhemoglobin and the blue color bar represents deoxyhemoglobin. The gray scale image was provided using a 900 nm single wavelength.