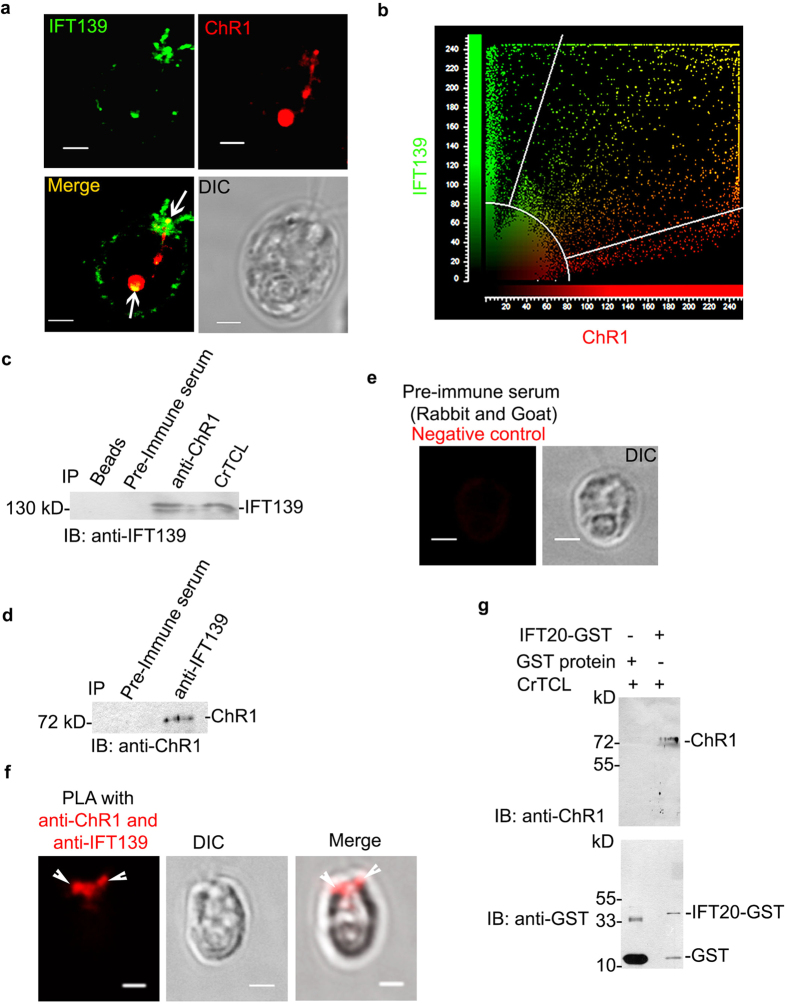
Figure 6.
ChR1 and Cop8 associate with IFT particles in C. reinhardtii (a) Colocalization of IFT139 and ChR1 mainly in eyespot and near basal bodies in wild-type CC-124 cells. Confocal micrographs of the C. reinhardtii cell labeled with IFT139 (green) and ChR1 (red). The merged image is shown in which yellow region represents colocalization. DIC image is also shown. (b) Scatter plot of co-localization signal of ChR1 with IFT139. Maximum overlapping red (ChR1) and green (IFT139) pixels at diagonal indicates significant co-localization between two pixels. (c,d) Immunoprecipitation (IP) of ChR1 in c and IFT139 in (d) using anti-ChR1-peptide and anti-IFT139 antibodies, respectively followed by immunoblotting (IB) with indicated antibodies. Protein bands of 139 kD in (c) and 78 kD in (d) represents IFT139 and ChR1, respectively. IP with pre-immune serum served as negative control in both the cases. (e) Proximity ligation assay (PLA) using the pre-immune serum (negative control). (f) PLA using anti-ChR1 and anti-IFT139 together with DIC and merged images. (g) GST pull-down of ChR1 from C. reinhardtii total cell lysate (CrTCL) using IFT20-GST as bait. Immunoblotting with anti-ChR1 (upper panel) peptide indicated that ChR1 was pulled down with IFT20-GST protein but not with the recombinant GST protein. Immunoblotting of the same membrane was performed with anti-GST (lower panel). Protein bands approximate to 23 kD, and 42 kD represents recombinant GST and IFT20-GST proteins, respectively. Scale bars represent 2 μm.

