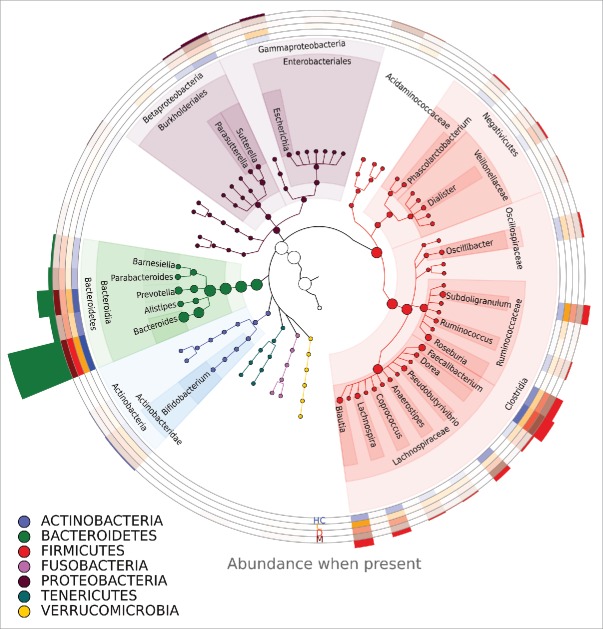
Figure 1.
The phylogenetic tree of bacteria detected in samples. Only genera present in more than 1% of reads are shown. A more intense color on a heatmap indicates a higher percentage of reads from a given genus. Circles with heatmap represent (from top to bottom) healthy controls, C-, D- and M-type IBS patients before treatment. The histogram above the circles represents the abundance of a genus in all reads. Genera are annotated by their phylum, order, and class or, in the case of the phylum Firmicutes, by their phylum, order, and family.

