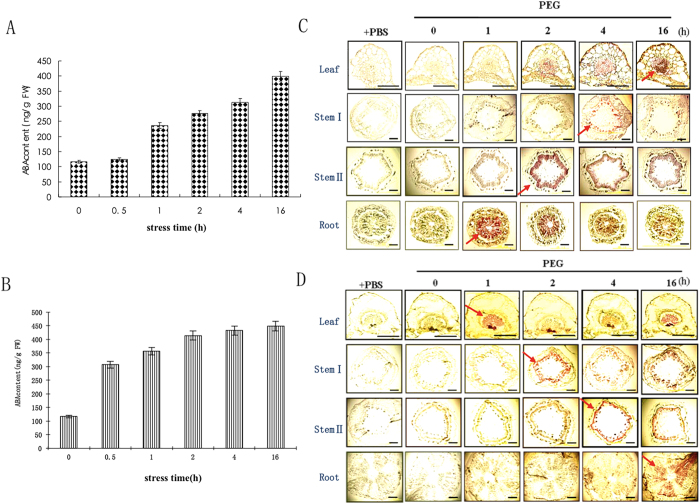
Figure 1. Effect of root and leaf stress on ABA level in leaves and AhNCED1 distribution in peanut tissues.
Plants were treated with PEG 6000 (30%) for the times shown. (A) Leaf ABA content under root stress. Data are representative of a single in three independent experiments. (B) Leaf ABA content under leaf stress. Data are representative of a single in three independent experiments. (C) Immunostaining of AhNCED1 in peanut under root stress. An arrow indicates the earliest time point at which AhNCED1 was detected in each tissue. (D) Immunostaining of AhNCED1 in peanut under leaf stress. An arrow indicates the earliest time point at which AhNCED1 was detected in each tissue. Controls were conducted with PBS, omitting the primary antibodies. The images shown are representative of three independent experiments with sections from three plant tissues. Bar = 50 μm for the leaf panels, and 100 μm for the stem and root panels.

