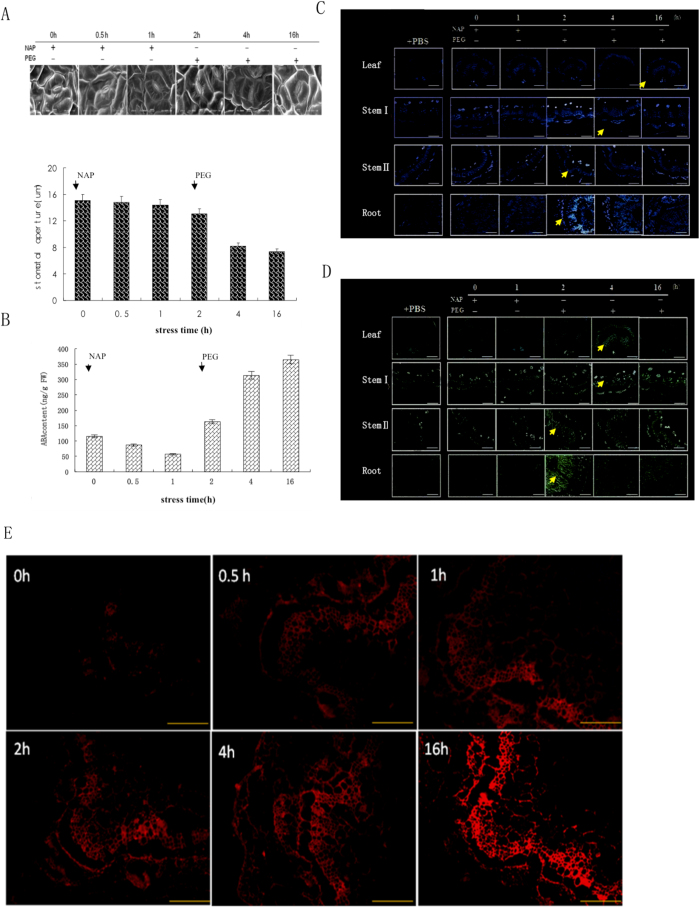
Figure 3. Effect of NAP on stomatal aperture, ABA level, and distribution of ABA and AhNCED1 in peanut in response to root stress.
(A) Stomatal aperture in leaves on treatment of roots with NAP for 2 h, followed by PEG treatment from 2 h up to 16 h. (B) ABA levels in leaves following the same treatment regime described for A. Bars are means (±SD) of n = 3. (C) AhNCED1 immunostaining of leaf, stem and root following the same treatment regime described for A. Control samples were treated with PBS; blue fluorescence (arrows) indicates the presence of AhNCED1; no color indicates a lack of staining. (D) ABA immunostaining of leaf, stem and root following the same treatment regime described for A. Control samples were treated with PBS; green fluorescence (arrows) indicates the presence of ABA; no color indicates a lack of staining. Bars = 50 μm for leaf panels and 100 μm for stem and root panels. (E) ABA distribution at the subcellular level in root of peanut following root stress. Red fluorescence indicates positive immunostaining; no color indicates a lack of staining. Bars = 100 μm.

