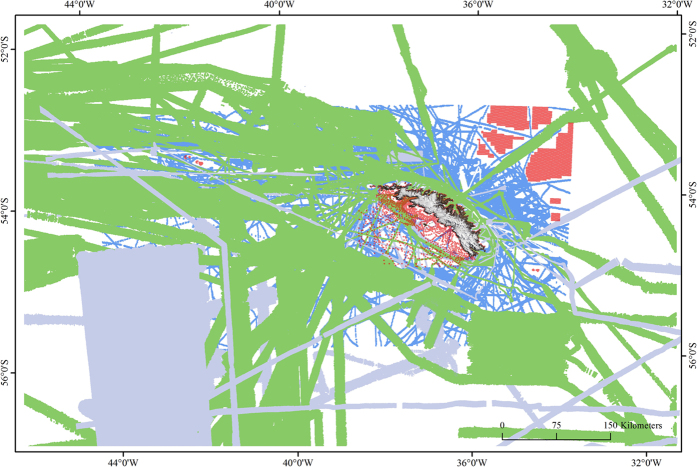
Figure 2. The spatial coverage of data sources used in the bathymetry compilation.
Multi-beam data derived from BAS cruises are shown in green; AWI and other multi-beam (see Supplementary materials Table 1 for sources) are shown in grey; single-beam data is shown in blue and UK Hydrographic Office and coastline data is shown in red. For the remaining white areas The GEBCO_2014 Grid, version 20141103 (http://www.gebco.netdata) was used. Figure was created using ArcGIS (version 10.1 [www.esri.com/software/Arcgis]).

